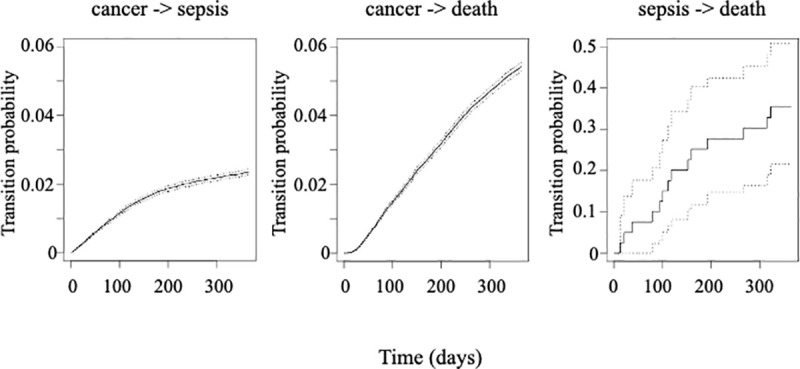
Fig 3. Transition probabilities within the first year after cancer diagnosis between the states « cancer », « sepsis » and « death » based on the multistate model.

Dark lines represent for a patient diagnosed with cancer at day 0 the probability of transitioning from one state to another over time; grey dotted lines represent the 95% confidence intervals. Cancer->death represents the transition from cancer to death without sepsis.
