Figure 2.
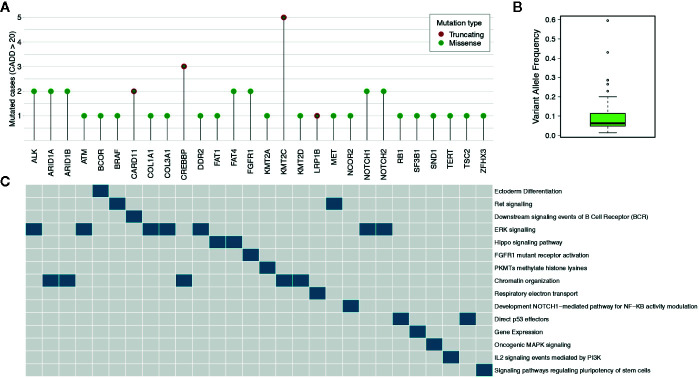
Highly pathogenic somatic mutations. (A) The lollipop plot shows the number of cases for genes having somatic mutations with pathogenicity scores higher than 20 as determined by CADD tool. (B) The box plot reports the median variant allele frequency of the selected somatic mutations. (C) The data matrix shows the pathways in which the mutated genes are involved (pathcards.genecards.org).

