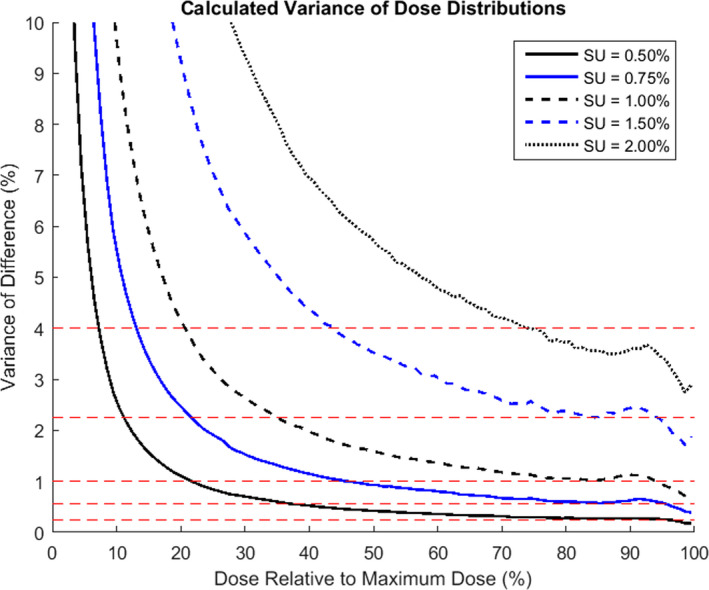
Fig. 1.

Calculated variance of the differences between the ground truth and a calculation with a given statistical uncertainty (SU) for all plans combined versus the relative dose of the interval of calculation. Each calculated variance is plotted at the mid‐point of the interval of consideration. The red dashed lines indicate the values of SU2 for the SU settings investigated.
