Fig. 2.

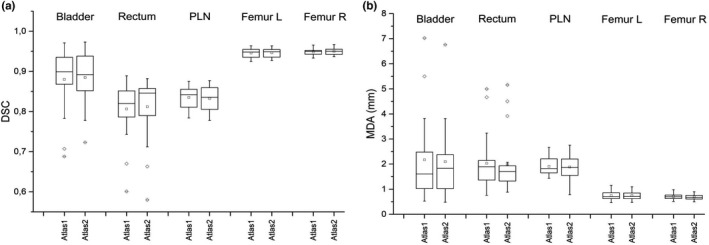
Box plots of dice similarity coefficient (a) and mean distance to agreement (b) between automatic contours, obtained with Atlas 1 and Atlas 2, and reference contours evaluated on a sample of 20 patients for different region of interests.

Box plots of dice similarity coefficient (a) and mean distance to agreement (b) between automatic contours, obtained with Atlas 1 and Atlas 2, and reference contours evaluated on a sample of 20 patients for different region of interests.