
Fig. 3.
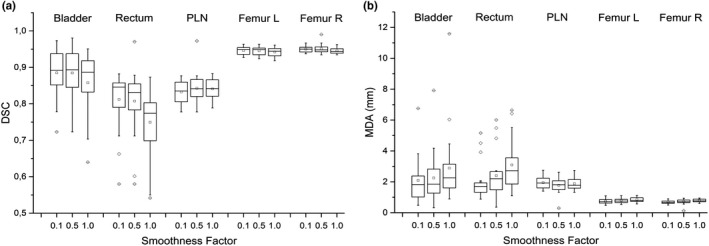
Box plots of dice similarity coefficient (a) and mean distance to agreement (b) between reference contours and automatic contours obtained with Same‐subject algorithm varying the smoothing factor and evaluated on a sample of 20 patients.
Official websites use .gov
A
.gov website belongs to an official
government organization in the United States.
Secure .gov websites use HTTPS
A lock (
) or https:// means you've safely
connected to the .gov website. Share sensitive
information only on official, secure websites.
Box plots of dice similarity coefficient (a) and mean distance to agreement (b) between reference contours and automatic contours obtained with Same‐subject algorithm varying the smoothing factor and evaluated on a sample of 20 patients.