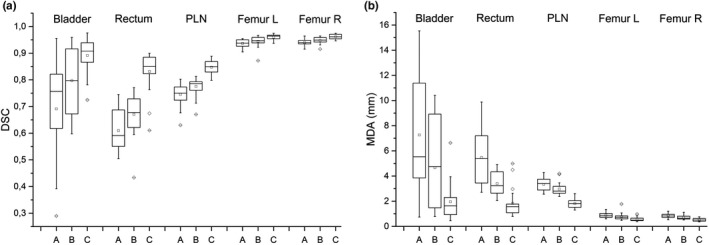
Fig. 9.

Box plot of dice similarity coefficient (a) and mean distance to agreement (b) between reference contours and automatic contours obtained using (a) MIM Atlas and workflow, (b) MIM Atlas and (c) our customized workflow and our Atlas and customized workflow on the sample of 20 patients for different region of interests.
