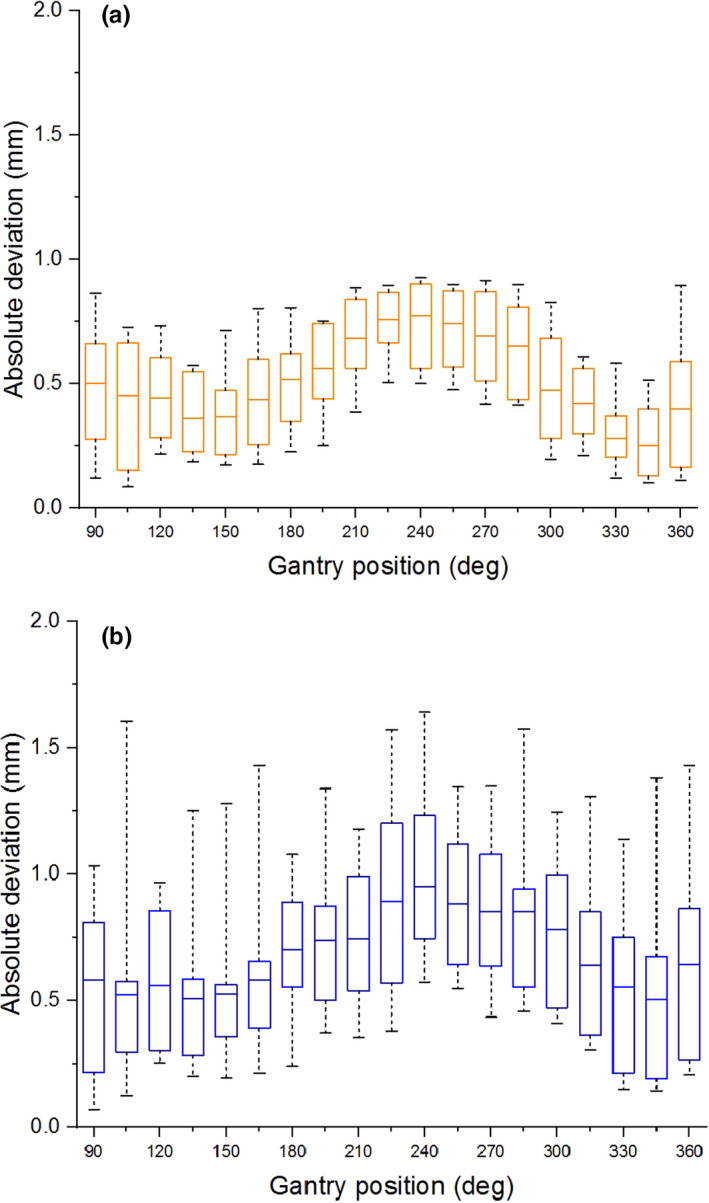
Fig. 9.

Geometric distortion as the gantry is rotated from 360° to 90°. (a) Whisker plots for absolute deviation of points 100 mm and (b) 152.25 mm from isocenter. The horizontal line within each box marks the mean deviation, the edge of each box indicates the 25th and 75th percentiles, and the whiskers show the maximum and minimum of the data.
