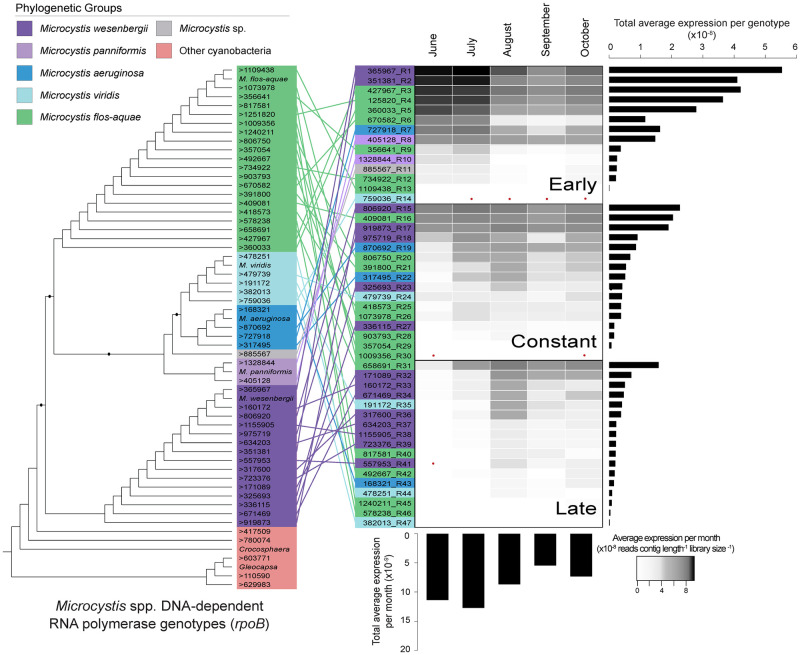
Fig 2. Expression of Microcystis genotypes.
Microcystis DNA-dependent RNA polymerase (RpoB) cladogram of genotypes, colored by phylogenetic group. Genotypes then rearranged based on temporal phase, with heatmap of the average total expression of each genotype. Bar charts represent the average total expression for each genotype and each month. Red dots indicate no expression.

