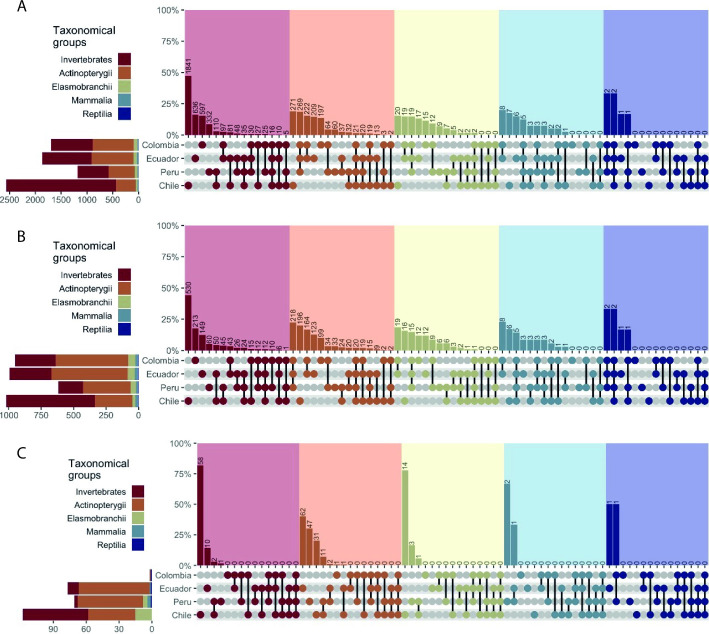
Fig 4.
Percentage of shared species through multiple combination of countries (depicted as dumbbell plots) and per taxonomical groups for three datasets (depicted at A, B, and C). In (A) only OBIS species are considered, in (B) only barcode records are considered, and in (C) barcode records with at least one entry collected from the Southeast Pacific are considered. Numbers at the top of each bar represent the total count of shared species in a given combination. Stacked barplots at the left margin of A, B, and C represent the total number of species per country.

