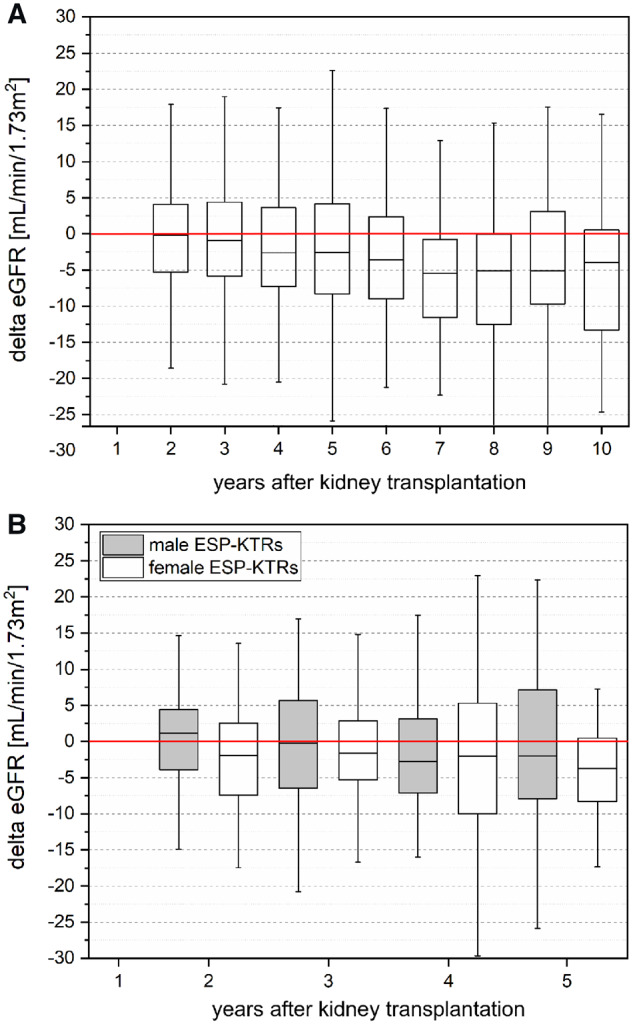
FIGURE 2.

(A) Change of eGFR (using the chronic kidney disease (CKD)-EPI creatinine equation) of ESP-KTRs with respect to baseline eGFR at 1 year post-transplantation. Change of eGFR showed a mean decline of 2.3 and 6.8 mL/min at 5- and 10-years post-transplantation. (B) Change of eGFR (using the CKD-EPI creatinine equation) of male versus female ESP-KTRs with respect to baseline eGFR at 1 year post-transplantation. No differences were observed between male and female ESP-KTRs at any time (P > 0.05). KTRs who lost their kidney allograft were represented in the year they lost their kidney allograft, but not thereafter. Boxes show the quartiles and medians, whiskers show the minimum and maximum values.
