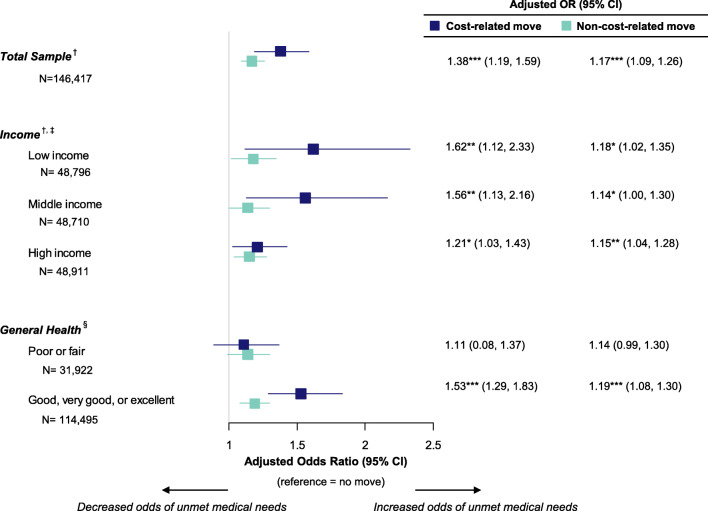
Figure 1.
Odds ratios of unmet medical needs relative to no move: total sample and stratified by individual characteristics. ***p < 0.001, **p < 0.01, *p < 0.05. Unweighted sample sizes are shown; all other values reflect weighted estimates. Source: Adult California Health Interview Survey, 2011–2017. †Odds ratios adjusted for gender, age, age squared, race/ethnicity, employment, log of income as percent of federal poverty level, education, number of adults in household, number of children in household, neighborhood type, health insurance, having a usual source of care, general health status, and survey wave. ‡Household income as percent of federal poverty level (FPL) stratified by tertiles, roughly corresponding to < 200% of FPL, 200–399% of FPL, and ≥ 400% of FPL. §Odds ratios adjusted for gender, age, age squared, race/ethnicity, employment, log of income as percent of federal poverty level, education, number of adults in household, number of children in household, neighborhood type, health insurance, having a usual source of care, and survey wave.

