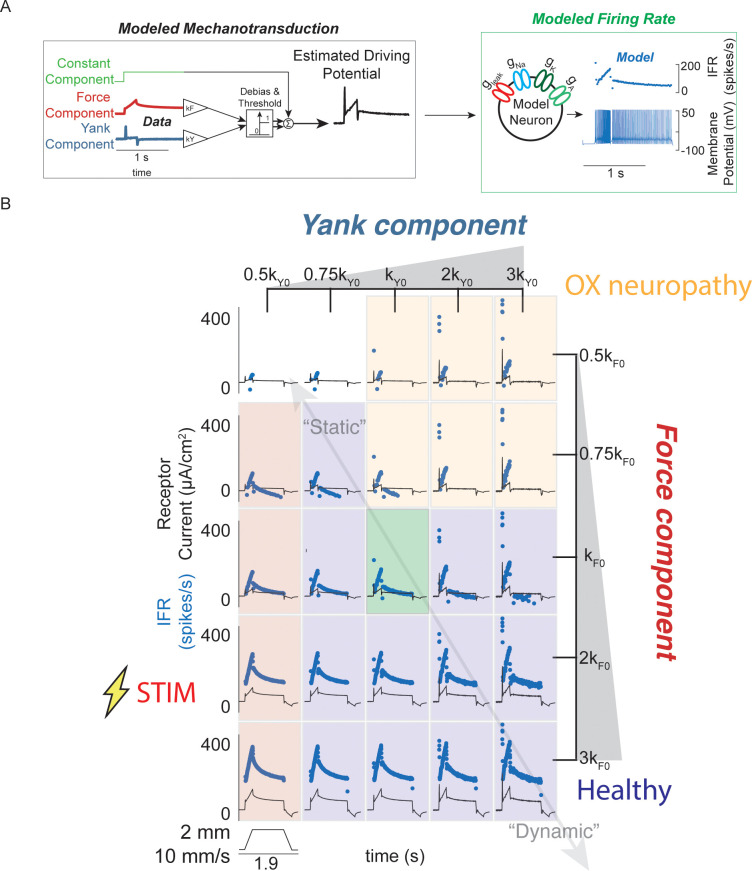
Figure 3. Spectrum of passive muscle spindle firing phenotypes accounted for by varying sensitivity to experimentally derived muscle fiber force and yank.
(A) Sensitivity to experimentally-derived force and yank was systematically varied for a single stretch and resultant driving potentials were input to a Connor-Stevens model neuron to generate firing patterns. (B) Nominal force and yank weights were identified to recreate experimentally-recorded muscle spindle response to a representative stretch (green box). Increasing sensitivity to yank (left to right) generated larger initial bursts and dynamic responses during the ramp, and resembled responses from oxaliplatin-treated specimens at the highest yank and lowest force sensitivities (orange boxes, compare to Figure 2E). Increasing sensitivity to force (top to bottom) generated higher firing rates during the hold period and resembled Ia afferent firing responses after axonal stimulation at the lowest yank and highest force sensitivities (red boxes, compare to Figure 2F). Varying the weights of the force and yank sensitivities could recreate the spectrum of healthy muscle spindle firing profiles reported classically (purple boxes).
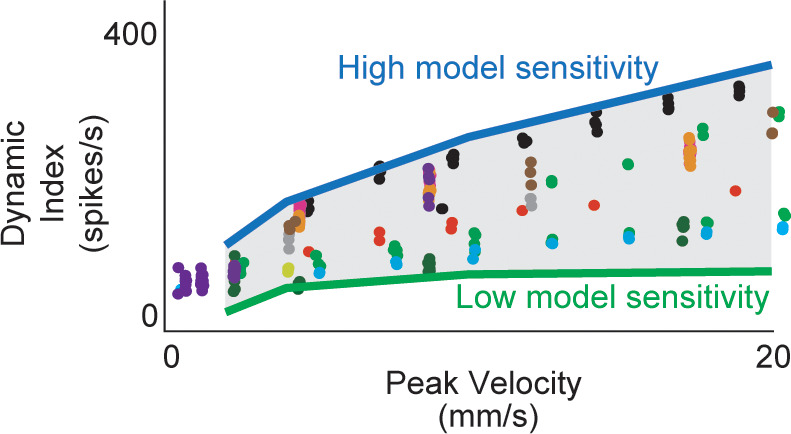
Figure 3—figure supplement 1. Estimated muscle fiber force model predicts inter-afferent variability of healthy afferent firing properties across perturbation velocity and acceleration.


