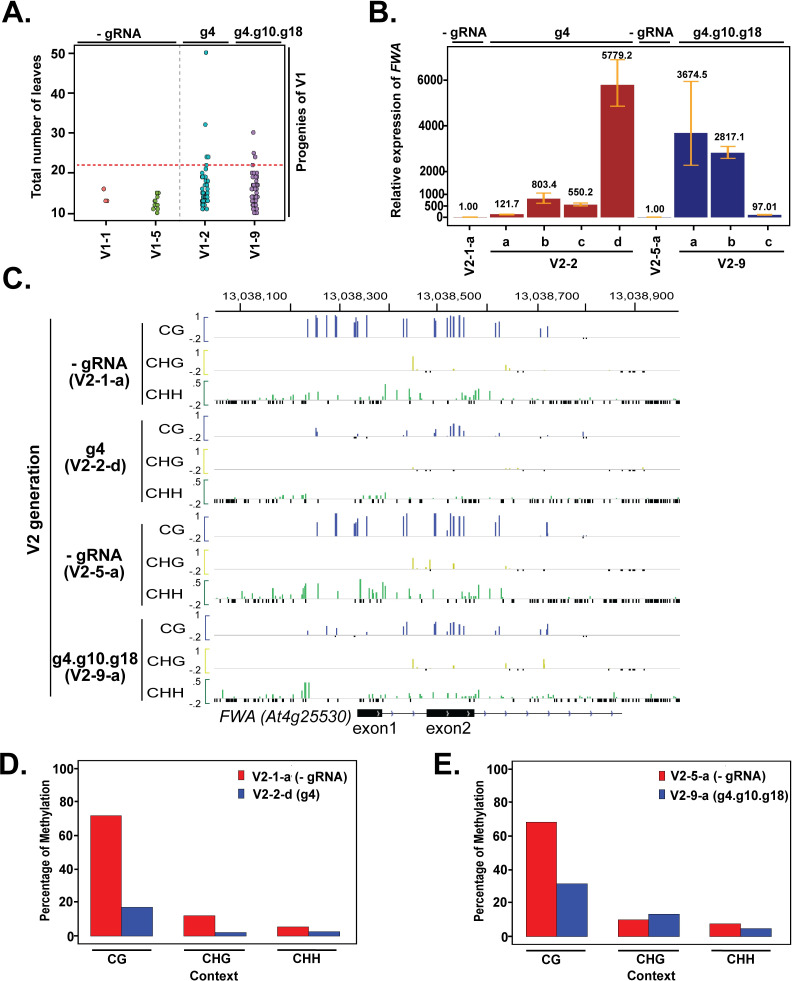
Fig 3. DNA demethylation and FWA expression is further enhanced in progeny of the TRV inoculated plants.
(A) Dot plot showing flowering time in the progeny (V2) of virus inoculated plants (V1). Total numbers of leaves at the time of bolting are shown. Number of plants used for flowering time analysis (V1-1 = 3, V1-5 = 11, V1-2 = 51,V1-9 = 55). (B) FWA expression in late flowering plants by reverse transcriptase-qPCR analysis. Error bars indicate standard deviations (n = 3 technical replicates). (C) DNA methylation profile at the FWA promoter region in V2 plants descended from either g4 or g4.g10.g18-treated V1 plants (V1-2, V1-9), relative to matched progeny of -gRNA treated control (V1-1, V1-5) plants. Data is obtained from whole genome bisulfite sequencing. Colors indicate methylation context (CG = Blue, CHG = Yellow, CHH = Green). Only cytosines with at least 5 overlapping reads are shown. Small, negative values (black) indicate cytosines with 5 or more overlapping reads but no DNA methylation. The Y axis range for CG and CHG methylation is -.2 to 1 and for CHH methylation is -.2 to .5. (D-E) Bar plots showing average methylation levels at different cytosine contexts at the FWA promoter (Chr4:13038100–13038900) in progeny of single guide RNA (V2-2-d) and multiple guide RNA (V2-9-a)-inoculated plants and their respective controls (V2-1-a and V2-5-a). Only cytosines with at least 5 overlapping reads were used for this analysis.

