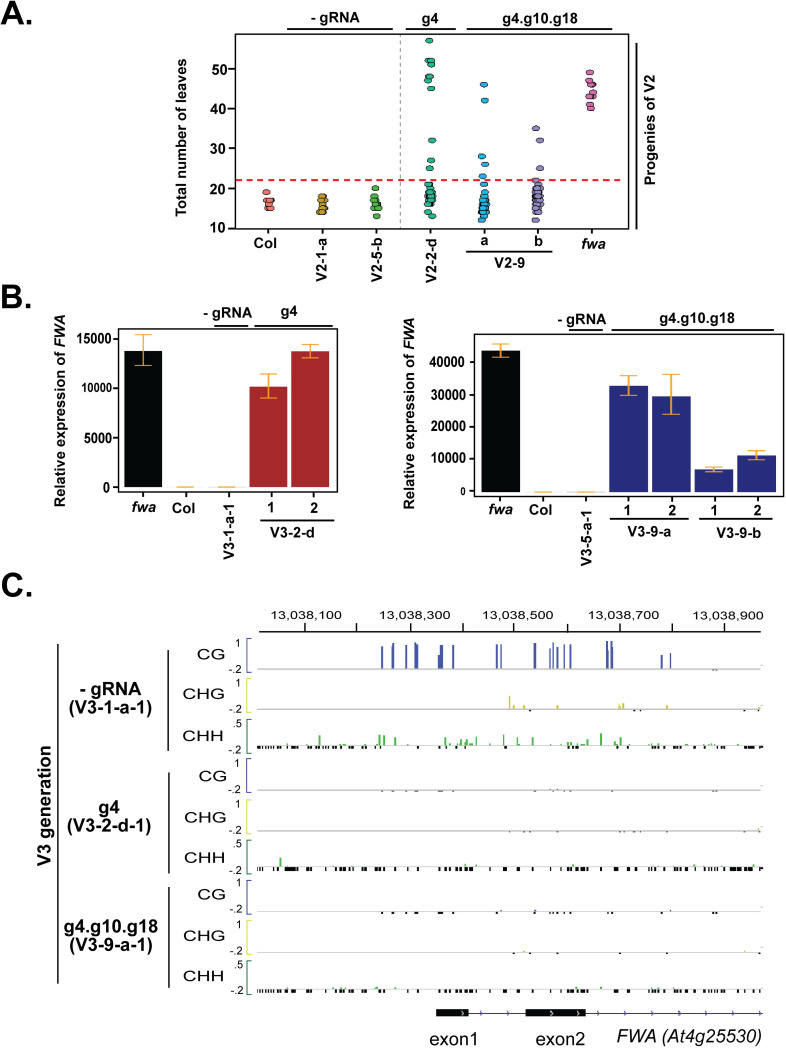
Fig 4. Near-complete loss of DNA methylation and strong gain of FWA expression in second-generation progeny of TRV-inoculated plants.
(A) Dot plot of leaf count at flowering time of the second-generation progeny of TRV-inoculated plants (V3). (B) FWA expression in late-flowering plants by reverse transcriptase-qPCR. Error bars indicate standard deviations (n = 3 technical replicates). Progeny of g4 inoculated plants shown left, g4.g11.g18 shown right. (C) DNA methylation profile at the FWA promoter region in V3 plants relative to control plants. Colors indicate methylation context (CG = Blue, CHG = Yellow, CHH = Green). Only cytosines with at least 5 overlapping reads are shown. Small, negative values (black) indicate cytosines with 5 or more overlapping reads but no DNA methylation.

