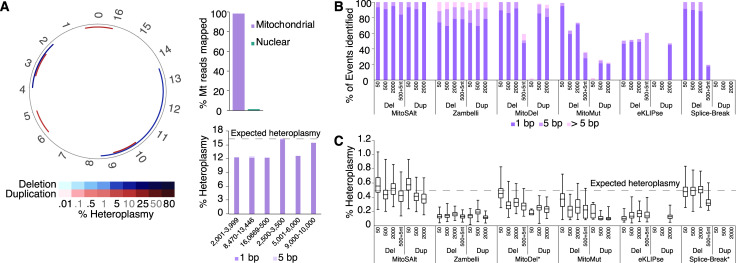
Fig 2. MitoSAlt pipeline performance on simulated data.
(A) Evaluation on simulated sequencing data harboring two synthetic deletions and 4 duplications, each at 16.7% heteroplasmy (2 × 126 bp, 10,000,000 reads, resulting in ~2,000× mtDNA coverage). The circular plot shows deleted (blue) or duplicated (red) segments. The upper bar graph indicates the fraction of Mt reads mapped to the mitochondrial genome, while the lower shows heteroplasmy levels estimated by MitoSAlt for each event (events with 1 bp or 5 bp of the expected breakpoints are quantified separately). (B) Evaluation of sensitivity on simulated sequencing datasets containing large numbers of low heteroplasmy deletions and duplications of various sizes. Each data set contained 200 minor or major arc events, each at 0.5% heteroplasmy (2 × 126 bp, 50,000,000 reads, resulting in ~6,000× mtDNA coverage. “500+5nt” refers to 500 bp deletions with 5 bp non-template random insertions at the breakpoint. (C) Box and whisker plot of heteroplasmy levels estimated by different pipelines. The boxes show 25th to 75th percentiles, and whiskers show the minimum and maximum value. *, These tools do not directly report heteroplasmy levels, and estimates were instead made based on the reported number of reads supporting each event and the average mitochondrial read-depth.

