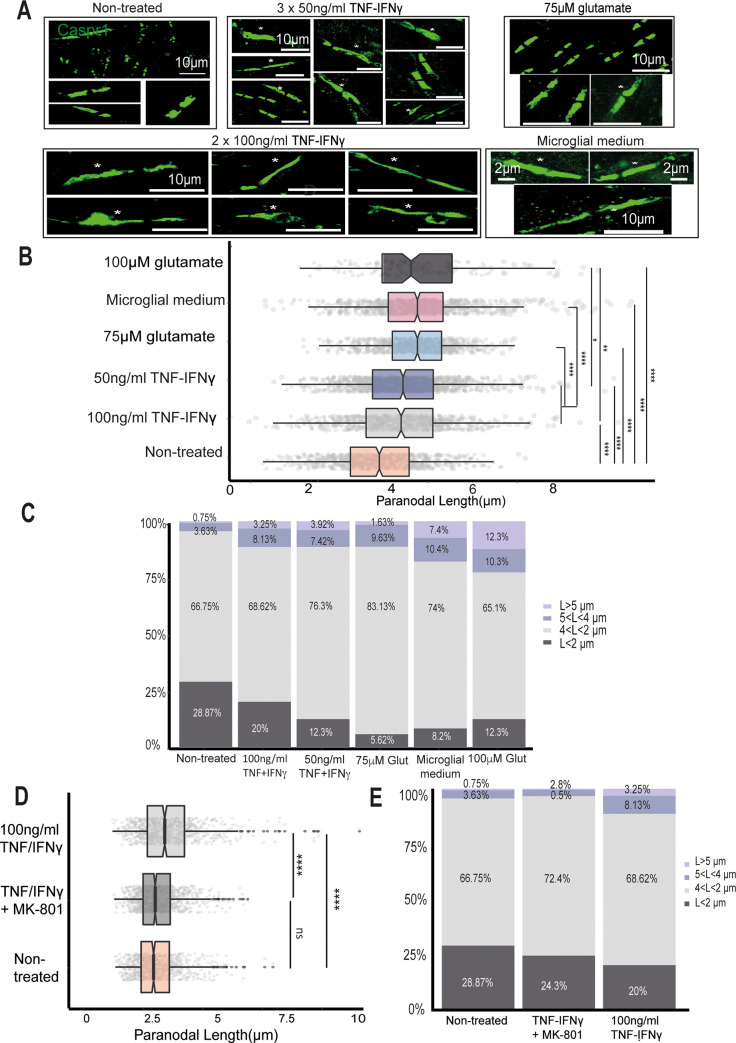
Fig 6. The proportion of elongated paranodes in cerebellar tissue slices treated with pro-inflammatory cytokines and glutamate.
(A) Confocal images of Caspr1-stained paranodes from nontreated cerebellar cultures, slices treated with 3 doses of 50 ng/ml TNF/IFNγ, slices treated with 2 doses of 100 ng/ml TNF/IFNγ, slices treated with 2 doses of 75 μM glutamate, and slices treated with 2 doses of microglial-conditioned medium (medium from primary microglia treated with 2 doses of 100 ng/ml TNF/IFNγ); asterisks point to long and disrupted paranodes. (B) Box-plots showing the different paranodal length distributions between the treated and nontreated cultures (nonparametric Kruskal–Wallis test and post hoc Wilcoxon rank sum test, ****p < 0.0001). (C) Bar plots of the same paranodal length distributions showing the proportion of paranodes in each data set of different lengths. (D) Box-plot of the paranodal length distributions of the nontreated cultures (orange), 2 doses of 100 ng/ml TNF + IFNγ with MK-801 (dark grey), and 2 doses of 100 ng/ml TNF + IFNγ alone (light grey) (**** p < 0.0001, Mann–Whitney test). (E) Bar plot showing the same paranodal length distributions divided into different length ranges. IFNγ, interferon-γ; TNF, tumour necrosis factor. Data and code to reproduce this figure can be found at: https://github.com/PatGal2020/PLOS_submission.

