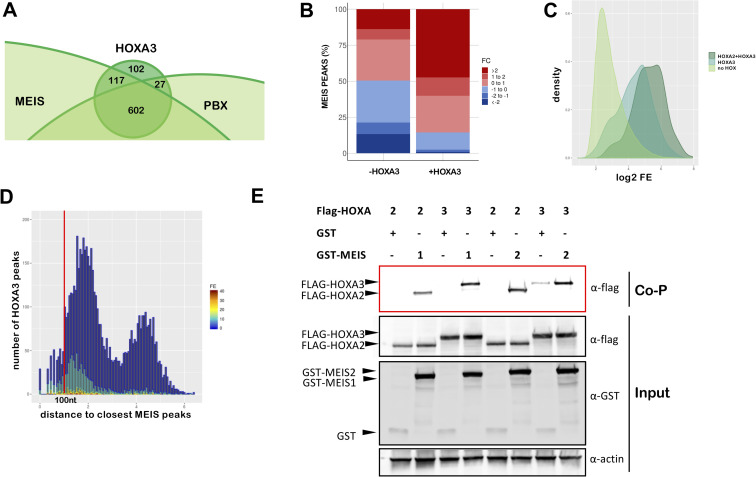
Fig 5. HOX cooperate with MEIS.
A. Overlap of HOXA3 with MEIS and PBX peaks in the same tissue (PBA) and at the same embryonic stage (E11.5) (200nt summit regions, overlap at least 1nt). The proportional Venn diagram is cropped to focus on HOXA3 peaks. B. Barplots of fold change in MEIS binding levels in PBA versus BA1. Regions co-occupied by MEIS with HOXA3 in PBA generally display higher MEIS binding levels in PBA (HOX-positive) relative to the HOX-negative BA1. In contrast, MEIS binding not overlapping HOXA3 can be higher in BA1 or in PBA. Fold changes in MEIS peaks were calculated using EdgeR (see also S7 Fig). C. Distribution of FE across different groups of MEIS peaks (PBA). MEIS peaks are sorted into: peaks not overlapping HOX (light green), MEIS peaks overlapping HOXA3 only (‘exclusive’ peaks, i.e. not overlapping HOXA2 in PBA, darker green) and MEIS peaks overlapping HOXA2 and HOXA3 (darkest green). Kernel density plot shows that MEIS peaks overlapping HOX display higher FE relative to MEIS only peaks. D. Distance of HOXA3 peaks relative to MEIS peaks (PBA). HOXA3 peaks are binned according to their log10 distance to the nearest MEIS peak and labelled according to FE (high FE, dark red bars; low FE, dark blue bars). High HOXA3 peaks mainly occur within 1kb of a MEIS peak. E. Co-precipitation assays. HEK293 cells were co-transfected with expression vectors for FLAG-tagged HOXA2 or HOXA3 and GST-tagged MEIS1, GST-tagged MEIS2 or GST alone. Protein interactions were assayed by co-precipitation on glutathione beads directed toward the GST tag and eluted proteins analysed by western blotting to detect the presence of FLAG-HOXA2 or FLAG-HOXA3 (red box, Co-P). Cell lysates were analysed by western blotting prior to co-precipitation to detect protein expression (input).

