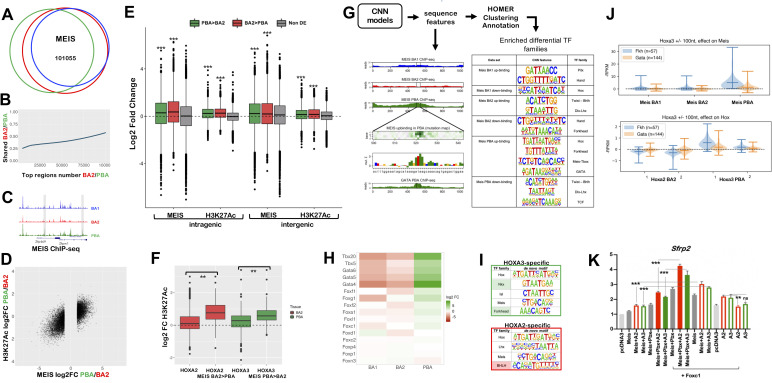
Fig 6.
A. Proportional Venn diagram shows highly overlapping binding of MEIS in BA1, BA2 and PBA. MEIS peaks were combined and re-centered using DiffBind; out of 215830 MEIS peaks, 101055 are in common between the three tissues. B. Top MEIS peaks are different in BA2 and PBA. At high FE, there is a lower overlap between MEIS binding in BA2 and PBA. The ratio of MEIS peaks, which are common to BA2 and PBA, increases as FE decreases. C. UCSC tracks illustrate the different MEIS binding levels in BA1-BA2-PBA at the Zfp496 and Zfpm1 loci. Instances of common MEIS peaks higher in one tissue (PBA) are shaded. D. Correlation plot of differential MEIS binding and differential acetylation (enhancer activity) at intergenic regions (PBA versus BA2). Each point corresponds to a region with MEIS log2 fold change >1 (FC>2); the corresponding H3K27ac value is plotted. Changes in MEIS binding levels are positively correlated with increased enhancer activity in the same tissue (correlation = 0.73). E. Boxplots of MEIS binding and H3K27Ac levels (log2 fold change) associated with differentially expressed genes. Peaks are associated with intragenic and intergenic (+/-100kb from transcription start and end sites) regions of differentially expressed genes (higher expression in PBA, green; higher expression in BA2, red; non-differentially expressed, grey). Irrespective of location, MEIS binding and acetylation levels are significantly higher (p<2.2e-16, one-sided t-test) when associated with genes with higher expression in the same tissue, relative to MEIS binding and acetylation associated with genes expressed at the same levels in BA2 and PBA. Data is ordered based on fold change of acetylation and MEIS binding (fold change of normalized read counts) and divided into quartiles. The central quartiles (50% of the data) are shown in the box, while top and bottom whiskers represent the top 25% and bottom 25% of the data, respectively. F. Changes in H3K27ac (log2RPKM) in BA2 and PBA for all HOX peaks and for HOX peaks overlapping MEIS differential binding higher in BA2 (HOXA2 peaks) and higher in PBA (HOXA3 peaks). Data is ordered based on fold change of acetylation (fold change of normalized read counts), as described above. HOX binding generally increases H3K27Ac; peaks associated with increased MEIS binding display a significantly higher increment of H3K27Ac in the same tissue (One-way ANOVA with post-hoc Tukey HSD; ** = p<0.001). G. CNN models of MEIS differential peaks uncover enrichment of tissue-specific sequence motifs as described [35]. MEIS binding was classified in six categories (i.e. peaks with higher/lower binding in BA1, BA2, PBA). CNN analysis identifies tissue-specific sequence features in each class of MEIS peaks. Predicted GATA binding in a MEIS PBA up-binding region is visualised as in the example (a feature matching GATA TF recognition motif on chr5:104257972-104258015 is shown). GATA6 ChIP-seq in PBA verifies this prediction. HOMER was used to cluster and annotate tissue-specific sequence features; features enriched in the different classes of MEIS peaks are matched to TF families with known tissue-specificity (see also Fig 6H). H. Heatmap of the expression of selected TF families, corresponding to cognate recognition motifs identified in MEIS PBA-up, in E11.5 mouse BA2 and PBA. Members of the GATA and TBX families, and the majority of expressed Forkhead TFs are enriched in PBA relative to BA2. Only TFs with expression values > 10 cpm in at least one tissue are shown. I. HOMER de novo motif discovery in HOXA3-specific and HOXA2-specific peaks. HOXA3-specific are HOXA3 peaks excluding peaks overlapping with HOXA2 BA2; similarly, HOXA2-specific are HOXA2 peaks excluding peaks overlapping with HOXA3 PBA. HOMER identifies enrichment of the same motifs enriched in BA-specific MEIS differential binding, Forkhead motif in HOXA3-specific (shaded in green) and BHLH motif in HOXA2-specific subsets (shaded in red). Variations of HD recognition motifs potentially recognized by HOX and attributed by HOMER to PBA-specific TFs NKX and ISL1 in PBA and LHX/DLX in BA2 are also enriched. J. Effects of Forkhead and GATA motifs on HOX and MEIS binding, assessed by in silico knockout. CNN MEIS PBA ‘up-binding’ features (Fig 6G) were annotated as HOX, GATA, and Forkhead (see methods). Co-occurring HOX- Forkhead motifs (distance between 1 nt to 100 nt) were selected for in silico mutagenesis. Forkhead mutagenesis results in a significant drop in HOXA3 binding in PBA, but shows no average significant effect on HOXA2 in BA2. Similarly, Forkhead mutagenesis significantly decreases Meis PBA binding across most tested sites. In comparison, much weaker effects are predicted on BA1 and BA2 MEIS differential binding. As a negative control, the same procedure was applied to co-occurring HOX-GATA motifs. GATA motif mutagenesis does not show significant average effects on HOX, or MEIS in HOX-bound regions. K. Luciferase activity driven by Sfrp2 enhancer co-transfected with Meis alone (grey bar) and with Hoxa2 (red empty bars), Hoxa3 (green empty bars); Meis and Pbx with Hoxa2 (red bars) and Hoxa3 (green bars) in the absence (left half of the graph) and in the presence of Foxc1 (right half of the graph, as indicated) in NIH3T3 cells. The last two samples contain Sfrp2 enhancer co-transfected with Hoxa2 (red empty bars), Hoxa3 (green empty bars). Adding Foxc1 to Hoxa2 or Hoxa3 with Meis2 and Pbx1a results in the highest activation.

