
Figure 5.
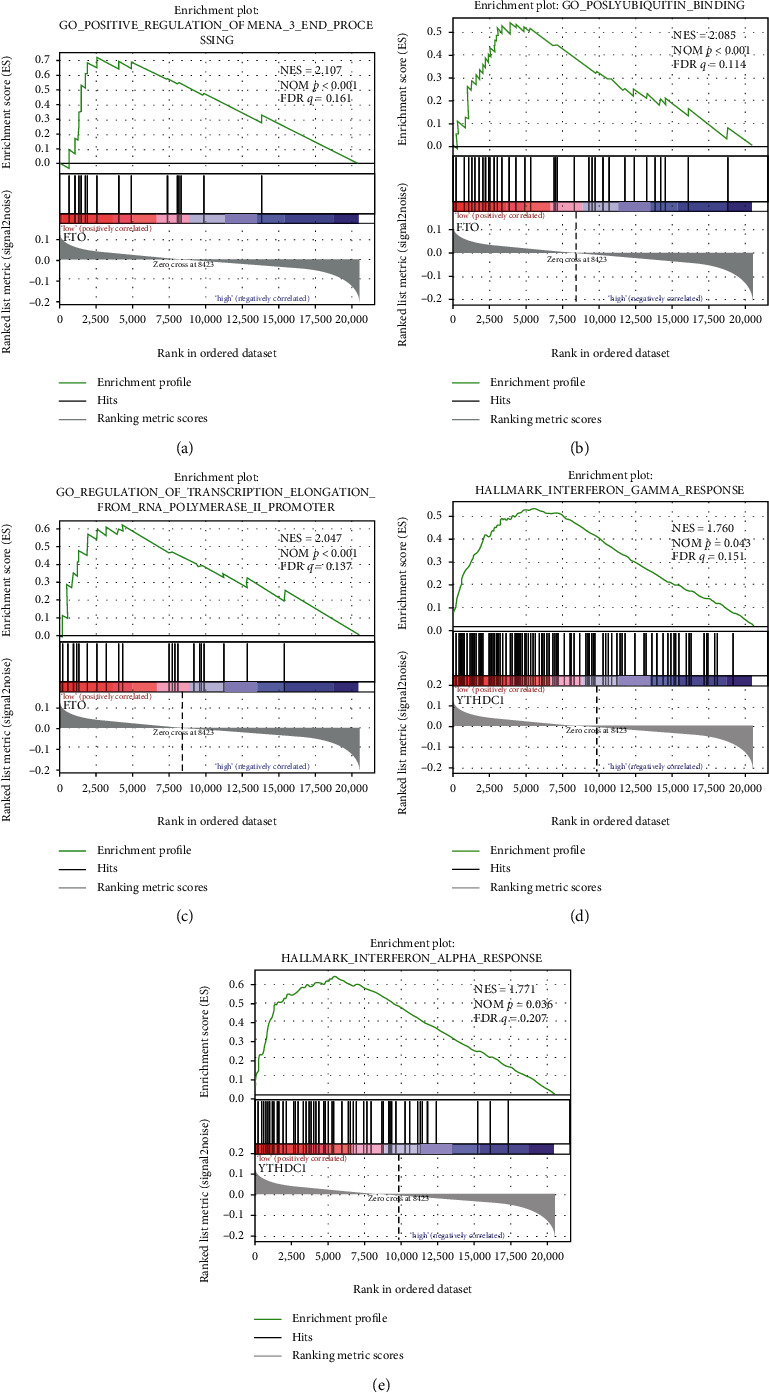
GSEA results of the mRNA level of FTO and YTHDC1. Gene set enrichment plots of (a) mRNA 3′ end processing, (b) polyubiquitin binding, (c) transcription from RNA polymerase promoter, (d) interferon-gamma, and (e) interferon-alpha response.
Official websites use .gov
A
.gov website belongs to an official
government organization in the United States.
Secure .gov websites use HTTPS
A lock (
) or https:// means you've safely
connected to the .gov website. Share sensitive
information only on official, secure websites.
GSEA results of the mRNA level of FTO and YTHDC1. Gene set enrichment plots of (a) mRNA 3′ end processing, (b) polyubiquitin binding, (c) transcription from RNA polymerase promoter, (d) interferon-gamma, and (e) interferon-alpha response.