
Figure 4.
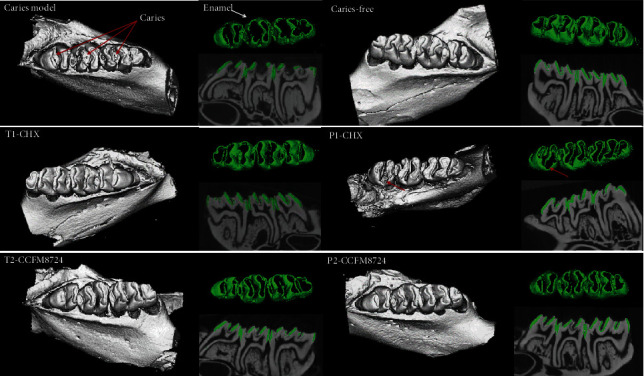
3D micro-CT image of mandibular molars, separated enamel (green), and corresponding 2D scale sagittal slice of the same molar (enamel is green) in each group. Red arrows: caries lesion site.
Official websites use .gov
A
.gov website belongs to an official
government organization in the United States.
Secure .gov websites use HTTPS
A lock (
) or https:// means you've safely
connected to the .gov website. Share sensitive
information only on official, secure websites.
3D micro-CT image of mandibular molars, separated enamel (green), and corresponding 2D scale sagittal slice of the same molar (enamel is green) in each group. Red arrows: caries lesion site.