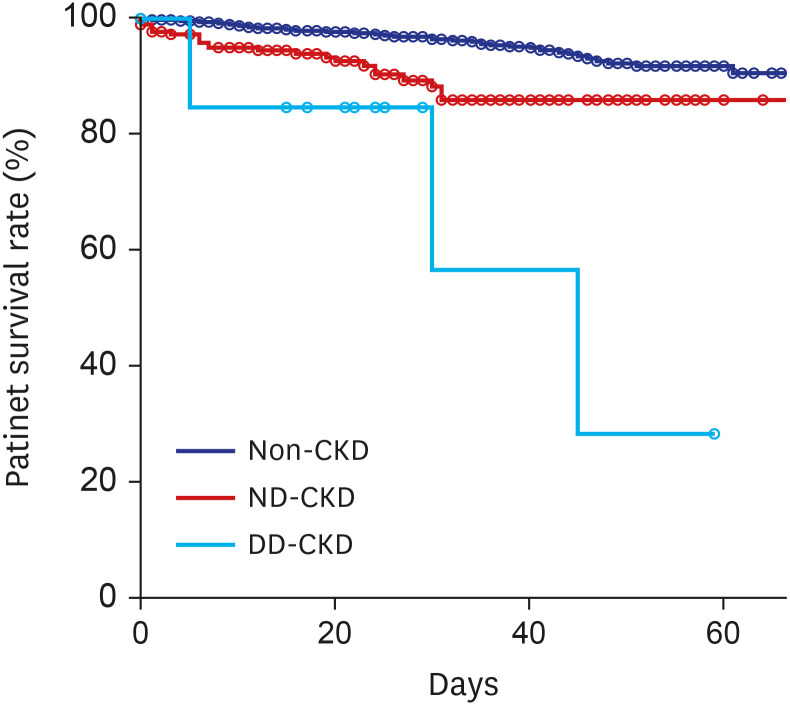
Fig. 1. Kaplan-Meier survival curves of the CKD groups. Blue, red, and skyblue lines reveal survival graphs of the Non-CKD, ND-CKD, and DD-CKD groups, respectively. Circle reveals a censored point. The 20-day survival rates were 97.6%, 92.4%, and 84.6% for the Non-CKD, ND-CKD, and DD-CKD groups, respectively (P < 0.001). The 40-day survival rates were 94.7%, 85.7%, and 56.4% for the CON, ND-CKD, and DD-CKD groups, respectively.
CKD = chronic kidney disease, Non-CKD = non-chronic kidney disease, ND-CKD = non-dialysis-chronic kidney disease, DD-CKD = chronic kidney disease requiring dialysis.

