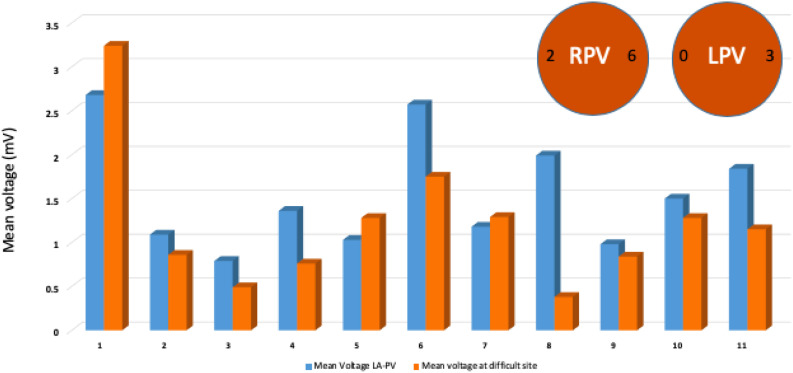
FIGURE 3.
Mean voltage at the site of failure of first pass isolation compared to mean voltage at the remaining sites from same LA-PV junction region. Descriptive analysis and comparison performed and illustrated by bar graphs of mean voltage showing lower baseline voltage at 8 of 11 sites of persistent PV connections. Typical location of persistent PV connection at posterior or anterior carina after first pass isolation highlighted by circles.

