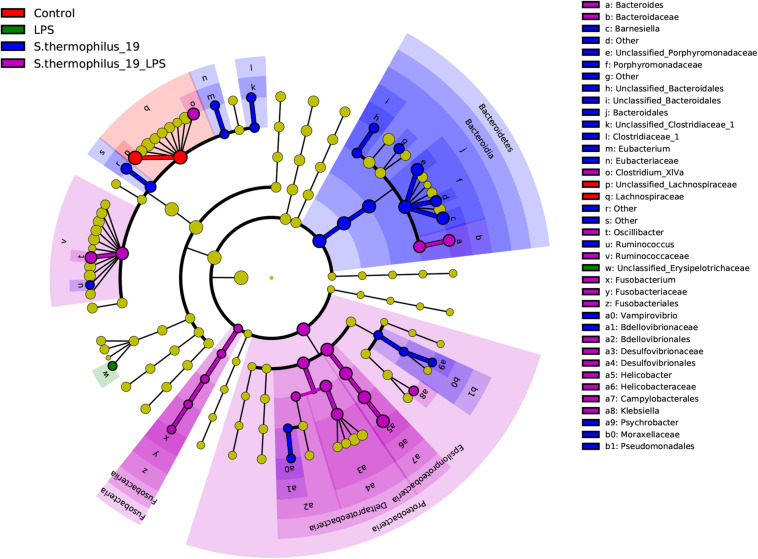
FIGURE 6.
Linear discriminate analysis effect size analyzed the differentially abundant features in the four groups. The cladograms represented here indicate the bacterial taxa that are significantly different between the four groups being compared. This analysis helps to identify a first selection of differential bacterial taxa in the considered groups.

