
Figure 5.
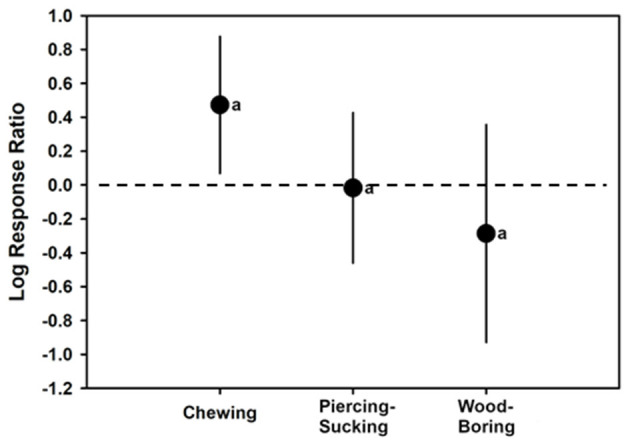
Mean (± 95% confidence interval) log response ratios representing changes in total phenolic levels in control plants with those colonized by chewing, piercing-sucking, or wood-boring insects. In cases where the confidence intervals did not intersect with 0, it was considered that the inducer caused significant cases. Different letters represent differences among the inducer groups by least significant difference (LSD) tests.