Figure 1.

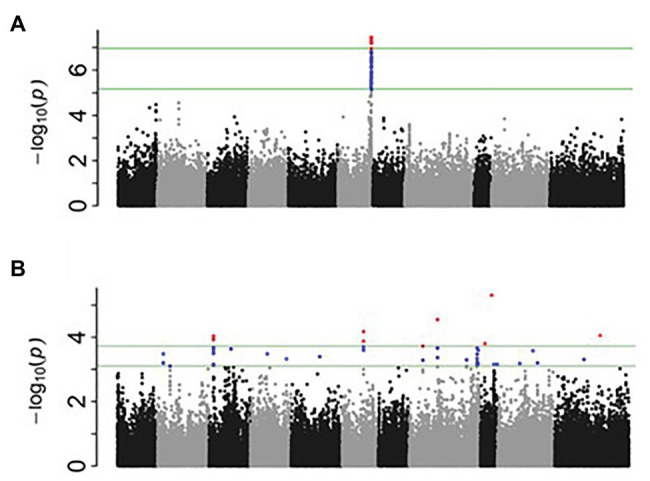
Manhattan plots generated from genome-wide association study (GWAS) analysis for nodulation (A) and percentage of N2-derived from atmosphere (%NDFA; B).

Manhattan plots generated from genome-wide association study (GWAS) analysis for nodulation (A) and percentage of N2-derived from atmosphere (%NDFA; B).