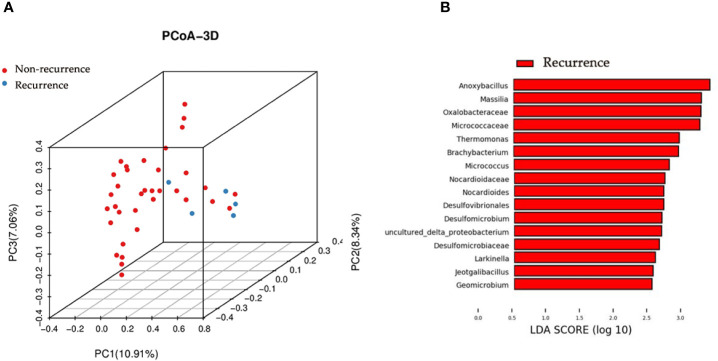
Figure 4.
Principal coordinate analysis and LEfSe analyses for RE patients and NR patients urinary microbiome. (A) Principal coordinate analysis plot of the urinary microbiome based on the unweighted distance metrics. (B) LEfSe analyses of urinary microbiomes of RE patients compared with NR patients. Genera enriched for RE group in red. No genera enriched for NR group according to LEfSe analyses. Only genera meeting a linear discriminant analysis score threshold >2.5 are shown.

