FIGURE 5.
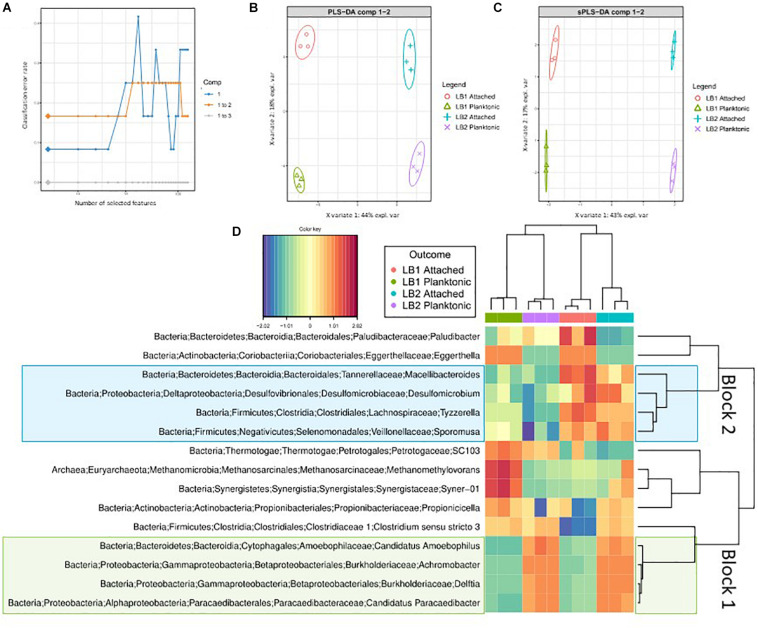
(A) sPLS discriminant analysis of amplicon sequencing data. Classification error rates over the components and the numbers of optimal features (genera) in each component, included in the model, chosen for the lowest error rates and represented by diamonds. (B) ordination of samples using all the genera in the first two components (sPLS-DA) where ellipses represent 95% confidence intervals and percentage variations explained by these components are denoted in the axes labels. (C) Ordination of discriminant taxa from the two components (sPLS-DA). (D) Heatmap showing discriminant genera. Rows and columns are ordered using hierarchical (average linkage) clustering. Heatmap depicts TSS + CLR normalized abundances: higher abundances are red and lower abundances are blue.

