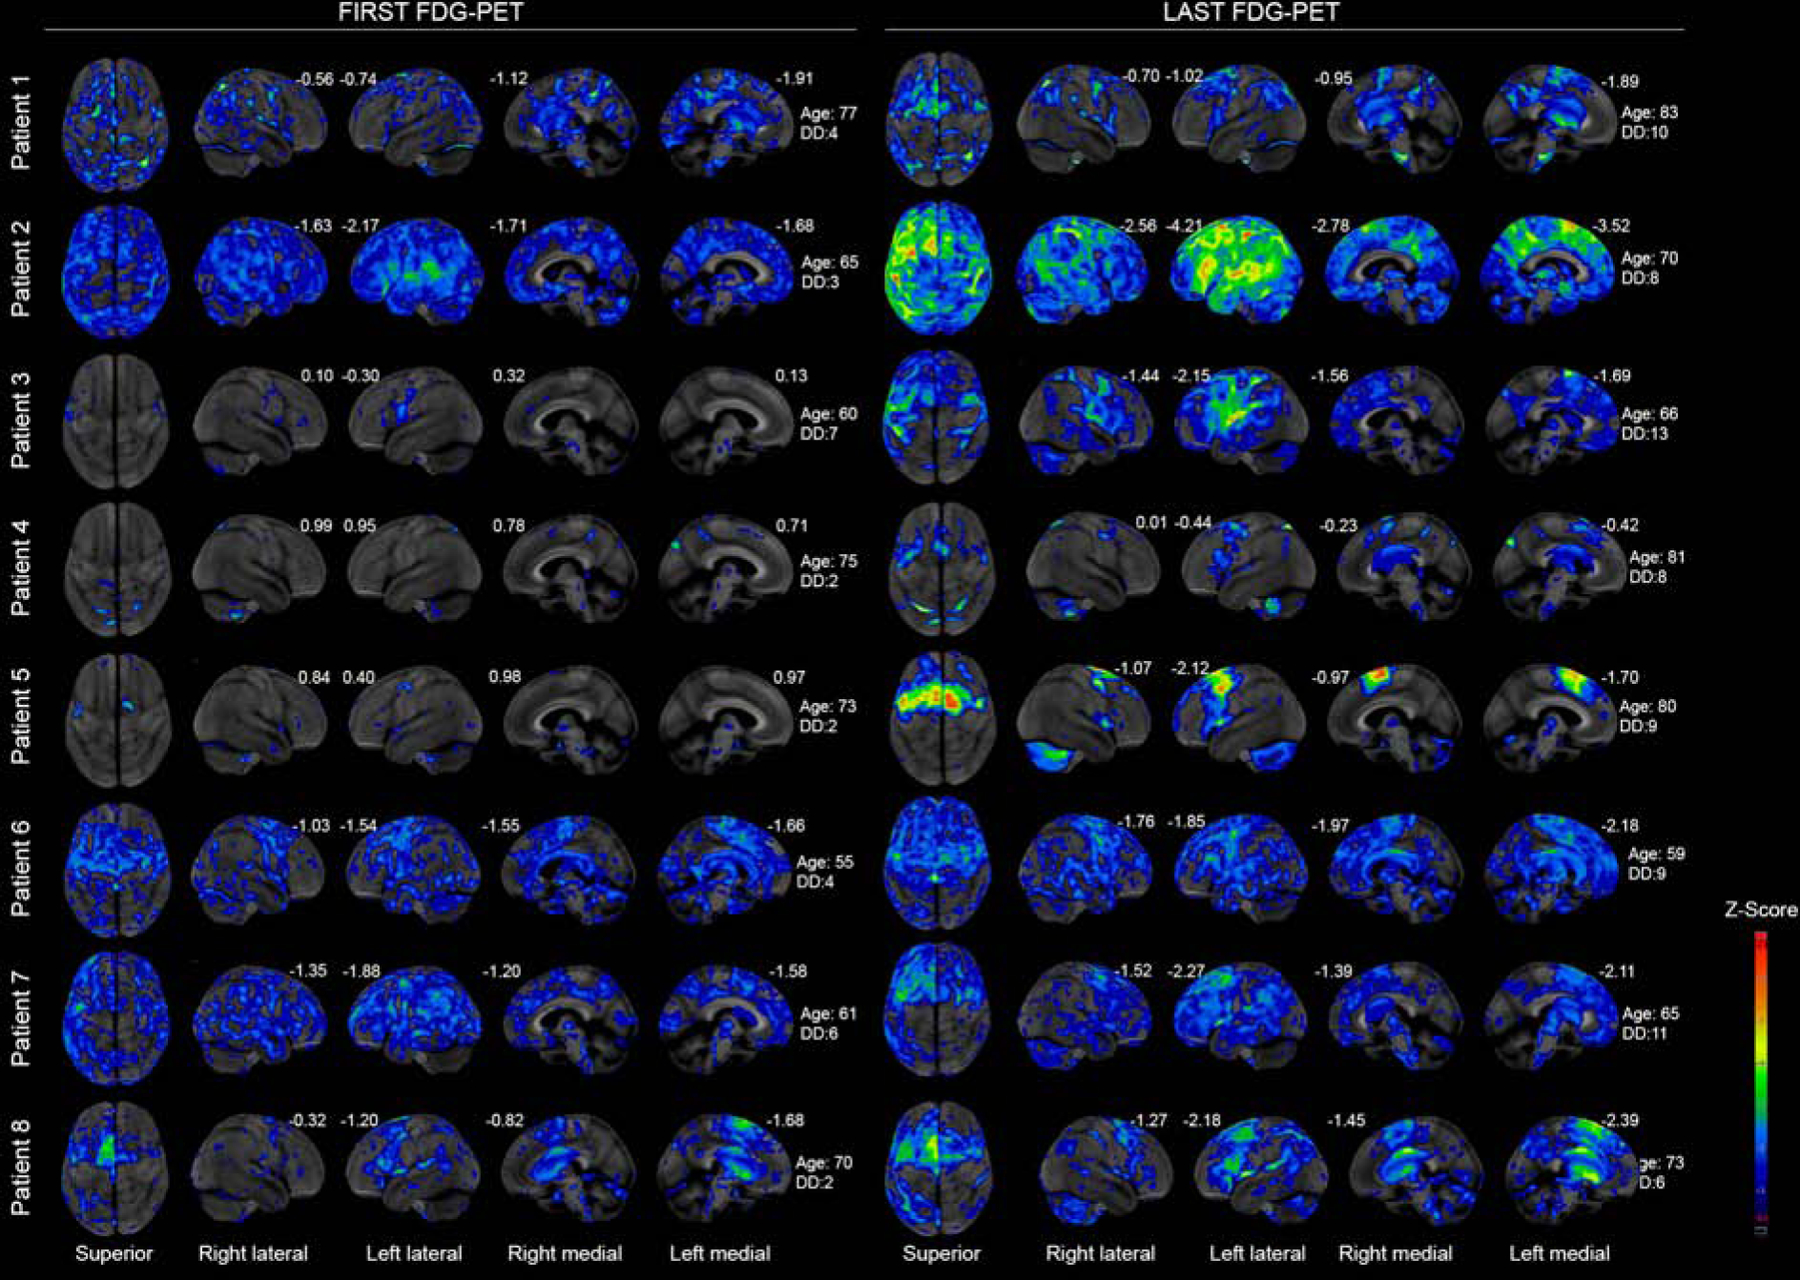
Figure 3: Superior views of FDG-PET scans of first and last visits for each patient showing hypometabolism as age-corrected Z-scores.

DD=Disease duration. On the left-hand side, first visit images and corresponding age at scanning and PPAOS duration are demonstrated. On the right-hand side, last visit images and corresponding age at scanning and disease duration are demonstrated. Numbers are Z-scores compared to metabolism of the same region in an age match normal control population.
