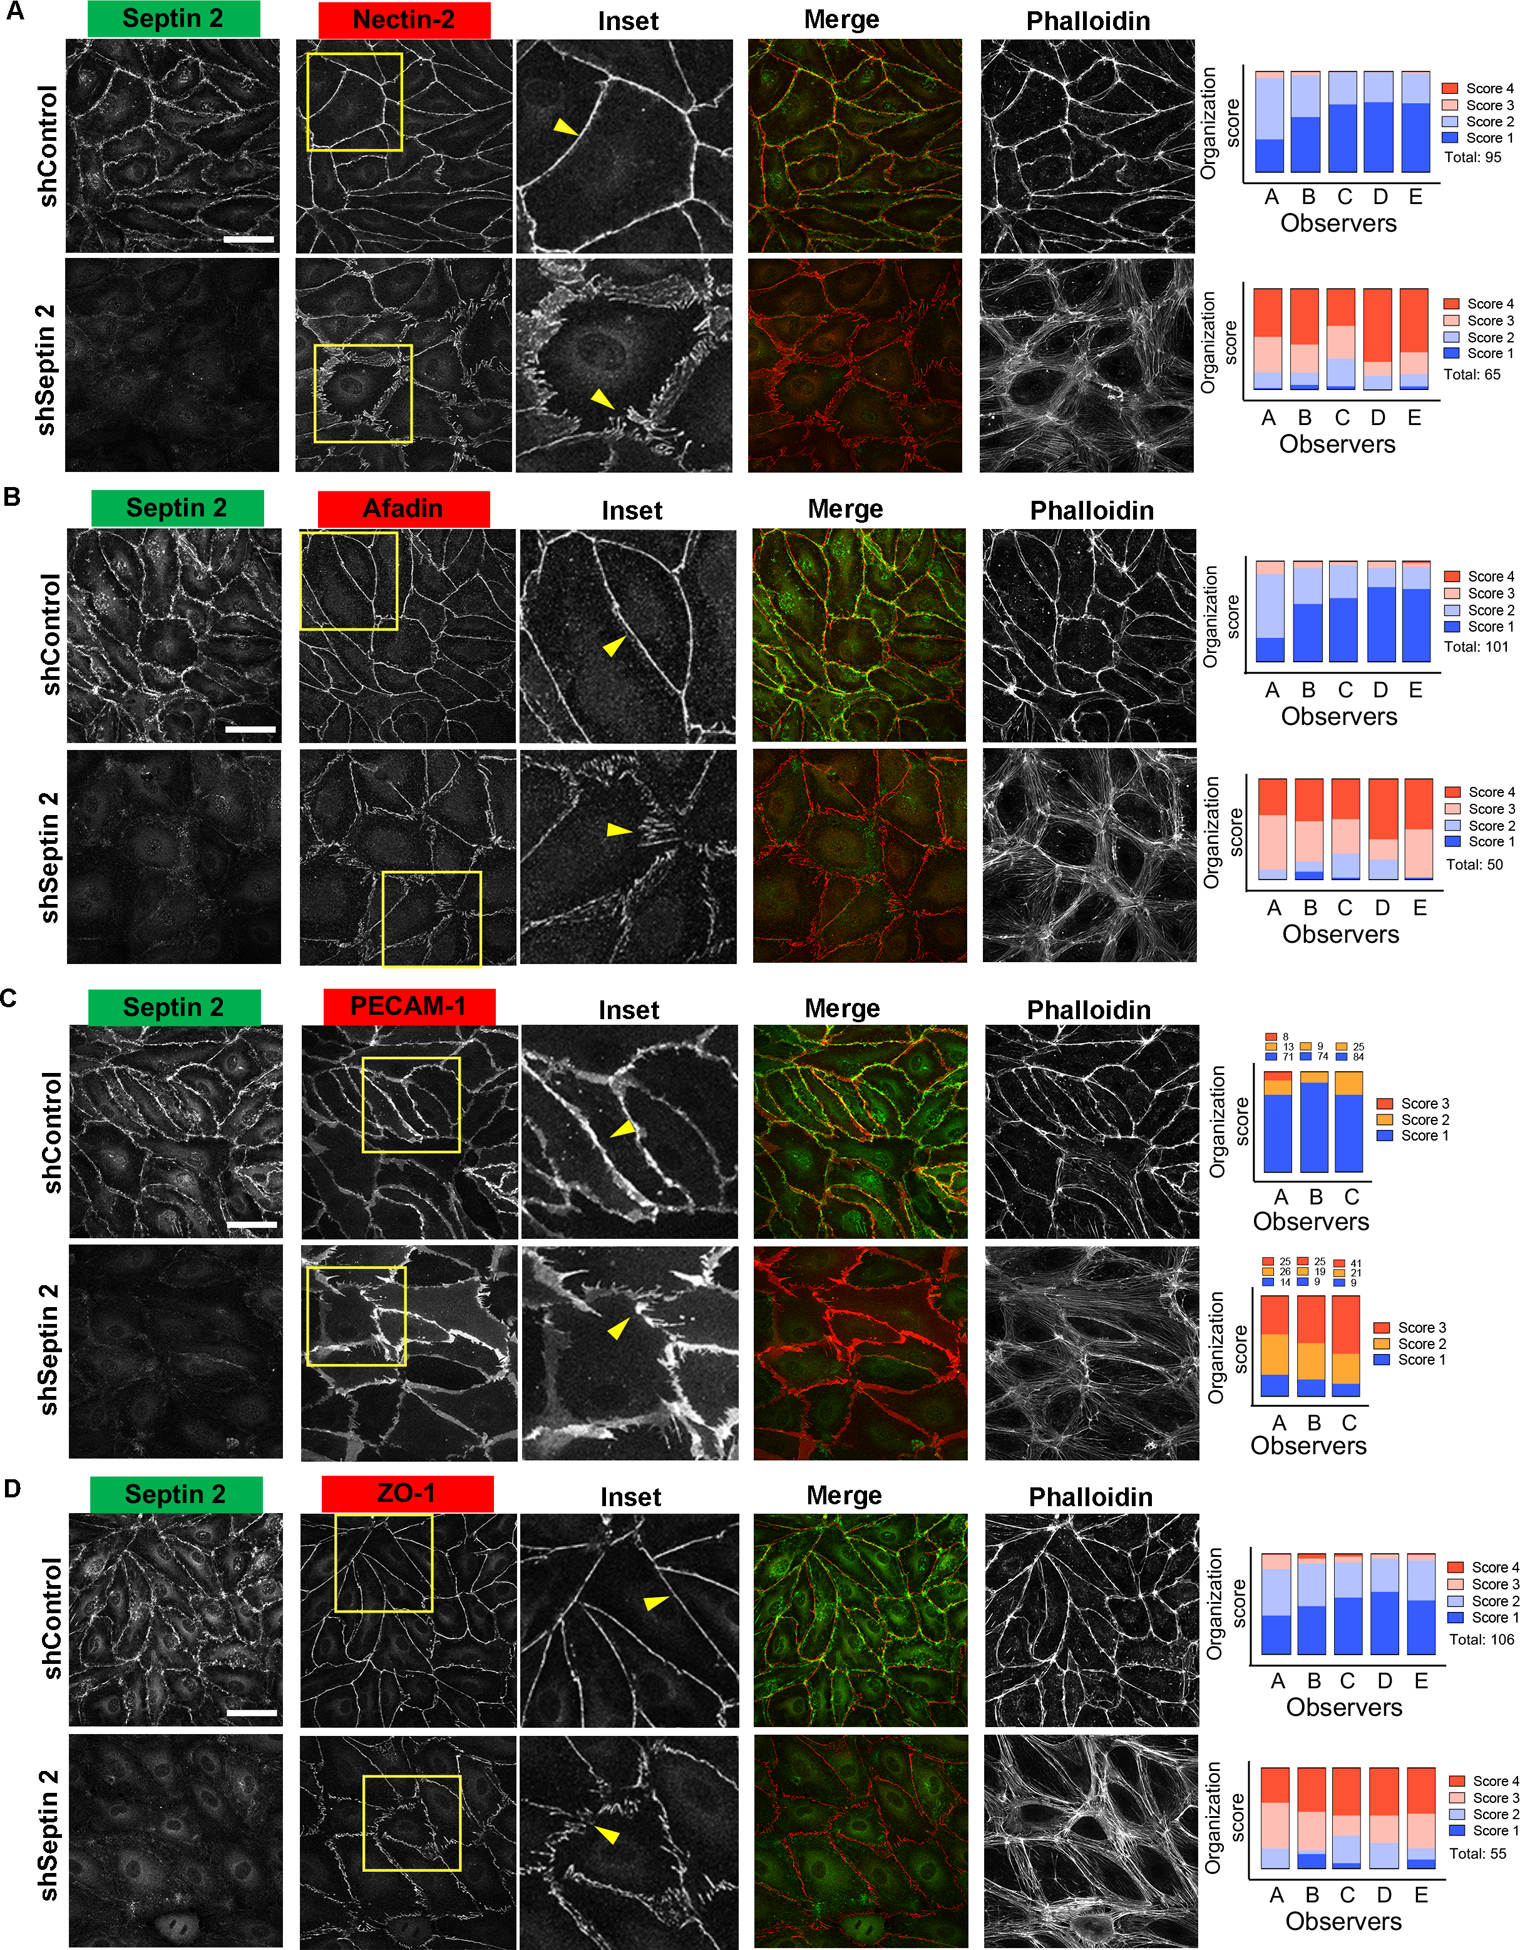
Figure 1. Suppression of septin 2 protein results in the disorganization of junctional proteins.

Immunofluorescence staining for endogenous septin 2 (green), cell-cell adhesion proteins (red), and actin filaments in HDMVECs and scoring of the organization of junctional molecules (A-D). Inset shows the enlarged area of cell-cell adhesion molecules. (A) Endogenous septin 2, nectin-2, actin filaments, and blind scores of nectin-2 organization are shown in control (Upper) and septin 2-suppressed HDMVECs (Lower). (B) Endogenous septin 2, afadin, actin filaments, and blind scores of afadin organization are shown in control (Upper) and septin 2-suppressed HDMVECs (Lower). (C) Endogenous septin 2, PECAM-1, actin filaments, and blind scores of PECAM-1 organization are shown in control (Upper) and septin 2-suppressed HDMVECs (Lower). (D) Endogenous septin 2, tight junction protein (ZO-1), actin filaments, and blind scores of ZO-1 organization are shown in control (Upper) and septin 2-suppressed HDMVECs (Lower). Scale bars: 50 μm. Variances among observers are statistically not significant. Differences in the organization of junctional proteins between control and septin 2-suppressed HDMVECs are statistically significant. p-values are < 0.0001.
