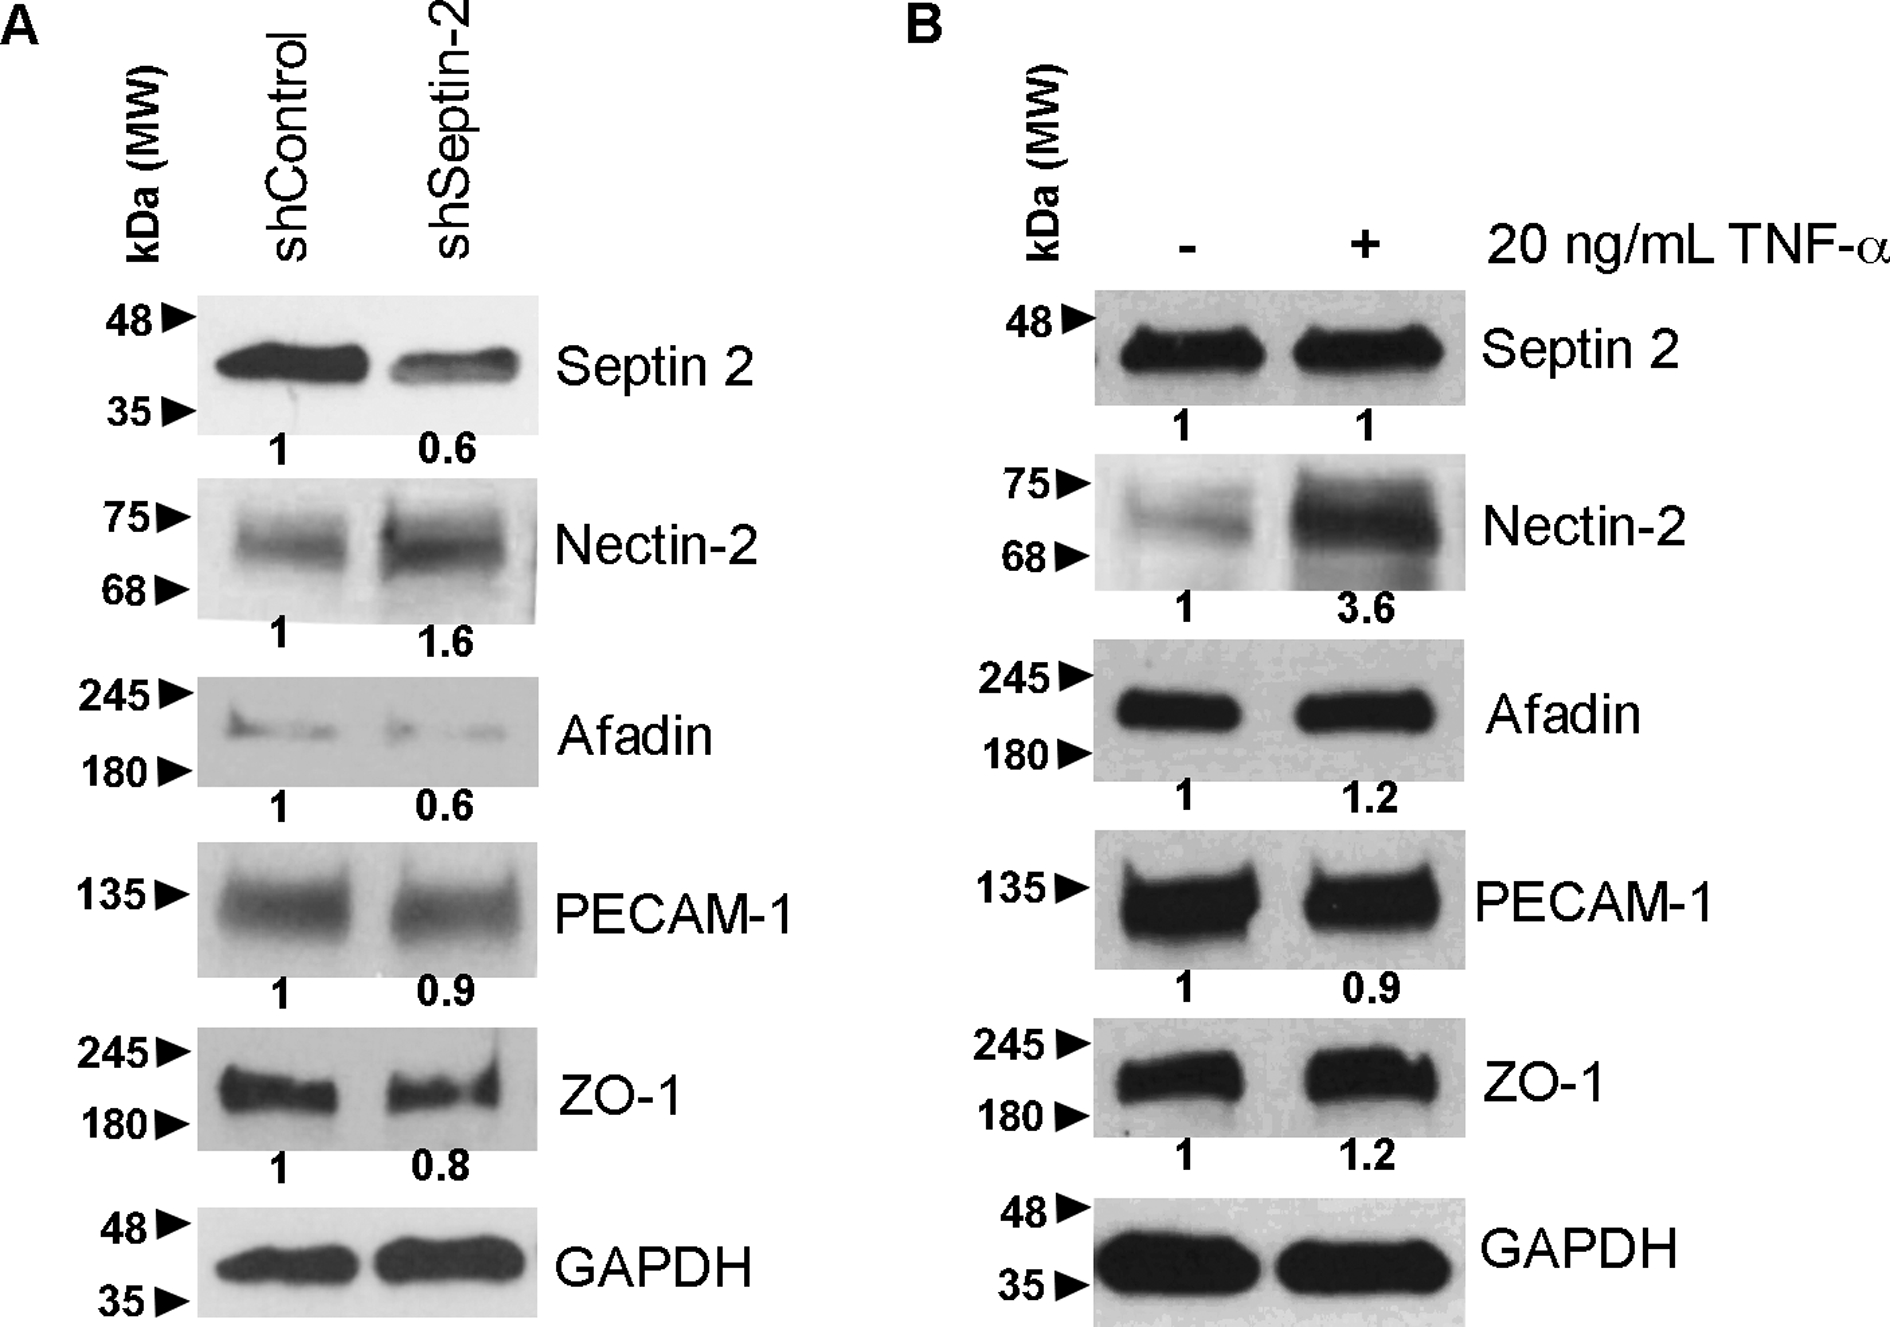
Figure 3. Expression levels of intercellular adhesion proteins in response to septin 2 suppression and TNF-α treatment.

Immunoblot analysis for junctional adhesion proteins. Expression levels of each protein are shown in response to (A) septin 2 suppression and (B) TNF-α treatment. GAPDH is an internal loading control. Band intensities acquired using ImageJ are shown.
