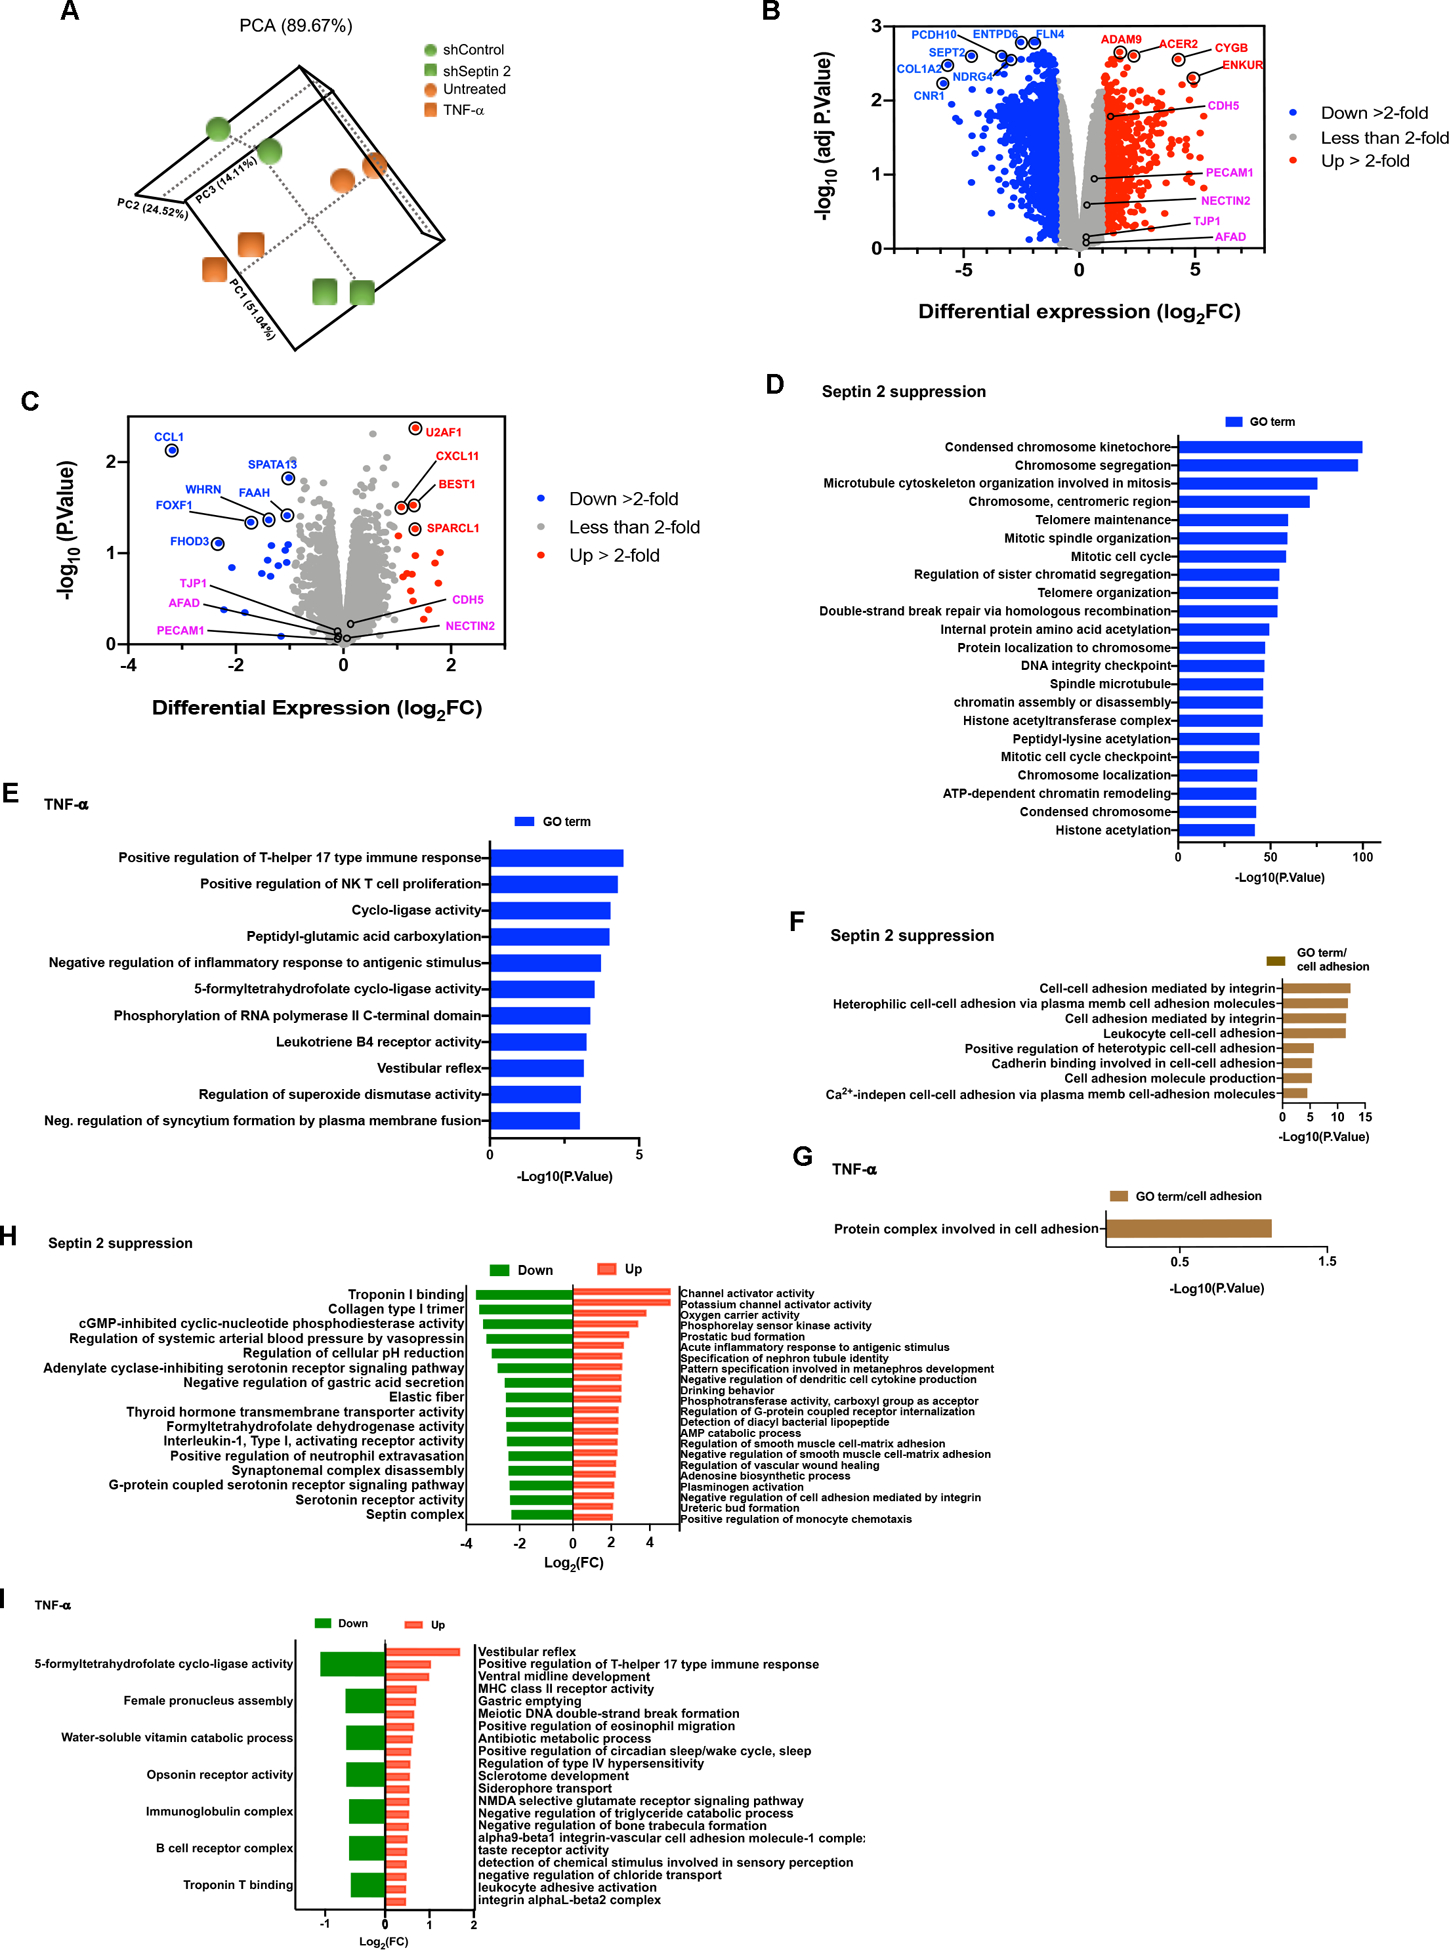
Figure 4. RNA sequence analysis with HDMVECs in response to septin 2 suppression and TNF-α treatment.

(A) Principal component analysis (PCA) of septin 2-suppressed and TNF-α-treated HDMVECs. PCA was performed with all genes. (B) Volcano plot of septin 2 suppression compared to control highlights differentially expressed genes using a fold-change > 2 as the cut-off value. (C) Volcano plot of TNF-α treatment compared to no treatment highlights differentially expressed genes using a fold-change > 2 as the cut-off value. Selected over-represented GO terms associated with various biological processes (D-E), cell-cell adhesion processes (F-G) and absolute fold-change > or <2 (H-l). Septin 2 suppression is compared to control, and TNF-α treatment is compared to no treatment.
