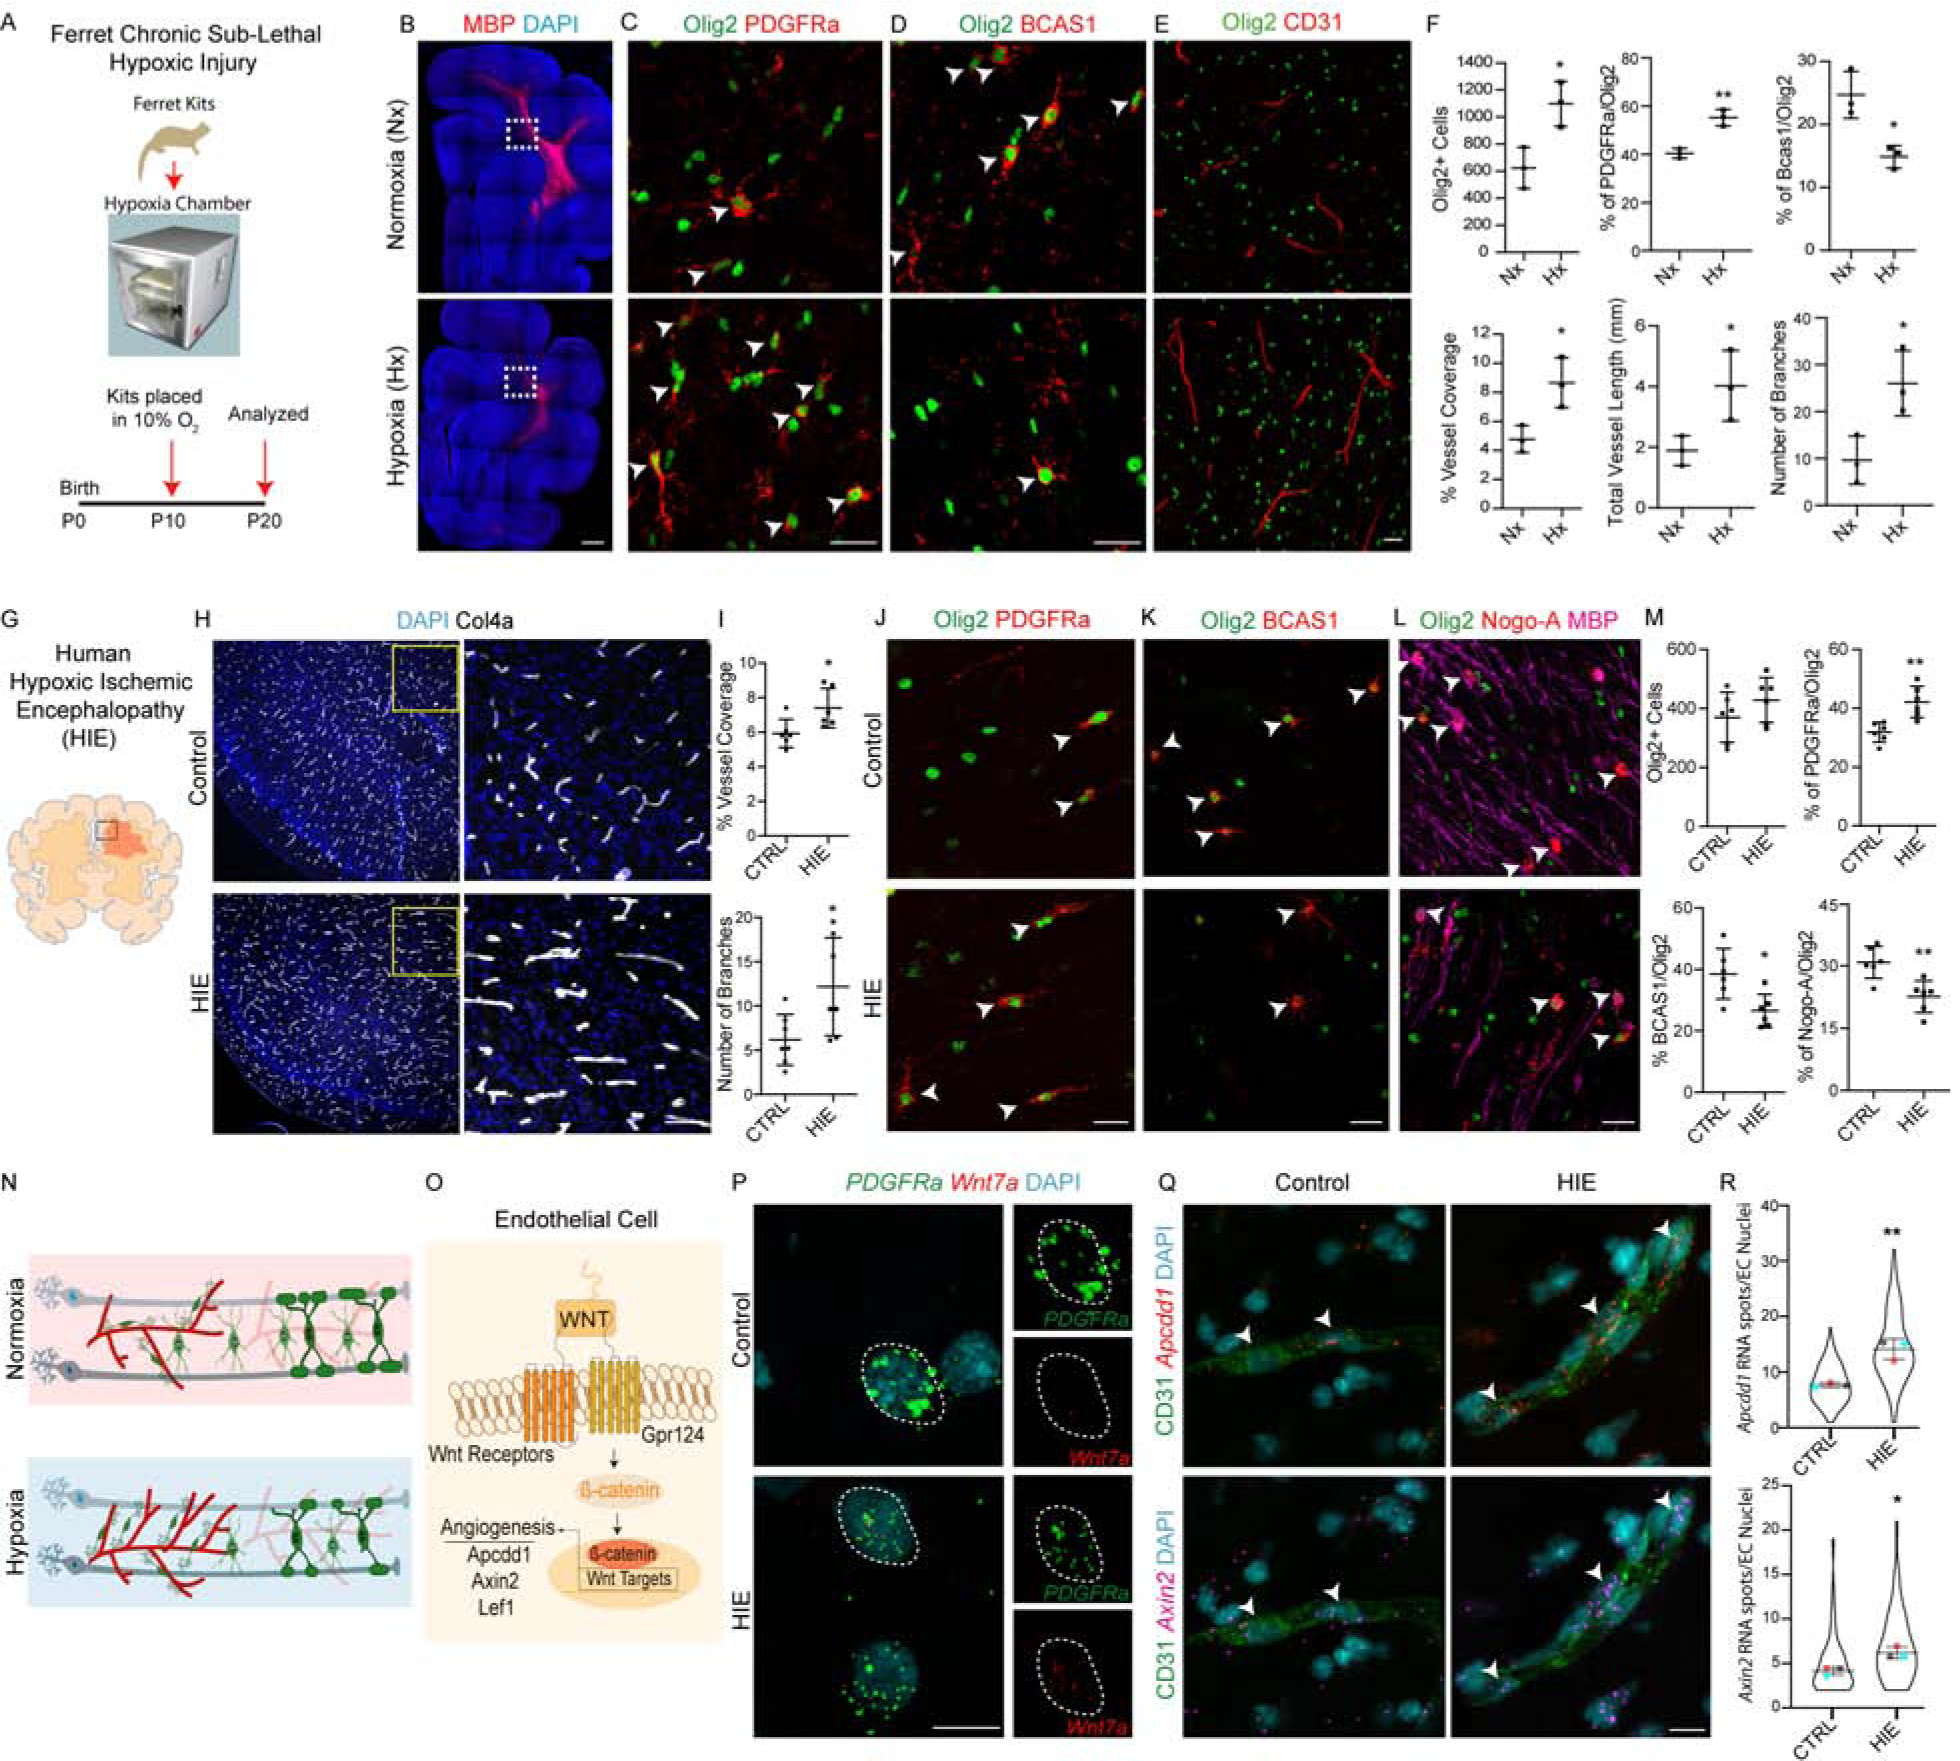
Figure 4: Neonatal White Matter Injury-Induced Increase in Vascular Density is Associated with Increased OPC Number and Upregulated Wnt7 Signaling.

(A) Schematic for neonatal ferret chronic sub-lethal hypoxic injury.
(B) Hypomyelination in hypoxic ferret brain. Coronal brain sections from Normoxic (Nx) and Hypoxic (Hx) reared ferret kits stained with myelin basic protein (MBP). Scale bar = 500μm.
(C–D) Increase in PDGFRa+Olig2+ OPCs (C) and decrease in immature BCAS1+Olig2+ immature OLs (D). Scale bars = 25μm.
(E) Increased CD31+ BV coverage in WM of Hx ferrets. Scale bar = 25μm. (F) Quantification of oligodendroglial lineage cells and BV coverage, branching and length in WM tracts of Nx and Hx P20 ferrets.
(G) Cartoon showing WM region in human hypoxic ischemic encephalopathy (HIE). (H) Representative images of WM tracts of cingulate from human HIE and age matched controls immunostained with BV marker Collagen 4a (Col4a). Note a robust increase in vascular coverage in HIE. Scale bar = 50μm.
(I) Quantification of WM vessel features in CTRL and HIE cases.
(J–M) Increase in OPC (PDGFRa+Olig2+; J, M) and decrease in mature OL (BCAS1+Olig2+ or Nogo-A+Olig2+MBP+; K–M) cell numbers in WM tracts of human HIE cases. Scale bars = 25μm.
(N) Cartoon showing hypoxia-induced cellular changes in the WM.
(O) Cartoon of OPC-induced endothelial Wnt signaling.
(P) Multiplex smFISH labelling of PDGFRa and Wnt7a in CTRL and HIE cases. Scale bar = 10μm.
(Q) Multiplex smFISH of Wnt signaling downstream targets Apcdd1 and Axin2 and CD31 immunolabelling reveals an increase in EC Wnt signaling in WM tracts of HIE cases. Scale bar = 10μm.
(R) Quantification of Apcdd1 and Axin2 RNA spots in CD31+ EC nuclei. Data are represented as mean ± S.D. and analyzed by two-tailed unpaired Student’s t test. n=3 animals/condition in (F), n=6 cases/condition in (I, M) and n=3 cases/condition for (R). Violin plots in (R) represent RNA spots quantified from atleast 100 cells from 3 different control and HIE cases and overlaying data point represents average number of RNA spots from a single case. Significance: *p<0.05, **p<0.01.
