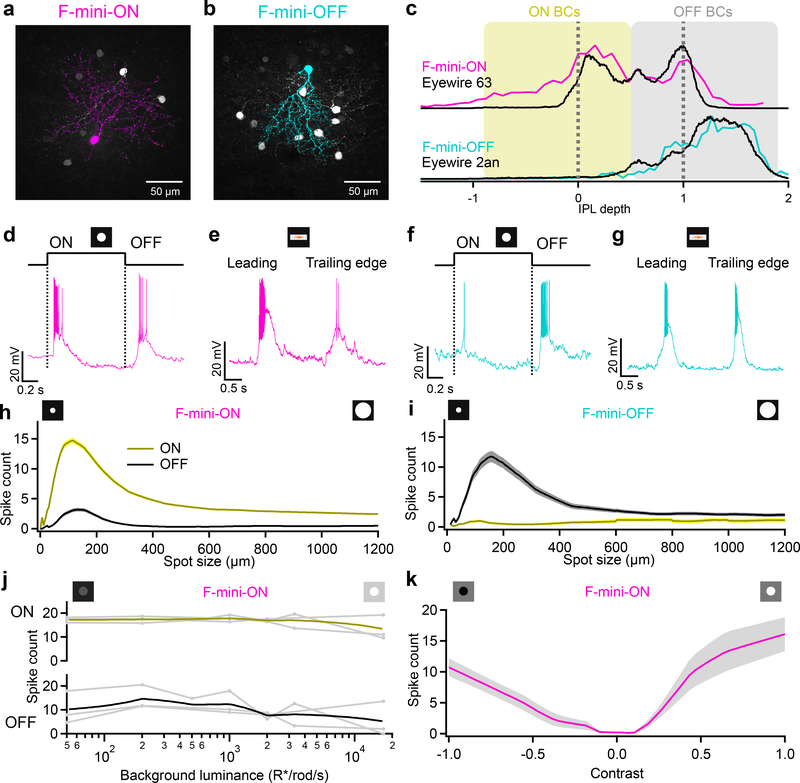
Figure 1. F-mini-ON and F-mini-OFF RGCs have both ON and OFF light responses.
a, b, Images of F-mini-ON and F-mini-OFF RGCs from fixed tissue. Magenta and cyan color scheme for RGC types is consistent throughout. All cell images throughout are shown with the dorsal direction on the retina toward the top of the page. Targeted RGCs were traced and colored, overlaid on gray. Morphology was consistent in all images (n = 40, 20 cells) c, Stratification profiles of an F-mini-ON and an F-mini-OFF RGC from our cell fills (colored lines) and from the data in the Eyewire museum (black). Dashed lines indicate ON and OFF choline acetyltransferase (ChAT) bands. Shading shows the stratification regions of ON (yellow) and OFF (grey) bipolar cells (BCs) in the inner plexiform layer. d, F-mini-ON RGC in current clamp responding to the onset and offset of a positive contrast spot from darkness to 200 isomerizations R*/rod/s. e, F-mini-ON RGC responding to the leading and trailing edge of a positive contrast moving bar (140 μm x 500 μm, 1000 μm/s, 200 R*/rod/s). f, g, Same as d, e for an F-mini-OFF RGC. h, Spike counts in F-mini-ON RGCs responding to positive contrast spots of varying diameters. Mean onset responses in yellow; mean offset responses in black;shaded region is SEM (n = 172 cells). i, Same as h for F-mini-OFF RGCs (n = 85 cells). j, Spiking responses of F-mini-ON RGCs to a flashed spot at varying mean luminance, showing the variations in ON and OFF responses with light level (n = 3 cells, spot diameter = 130 μm). k, Spiking responses of F-mini-ON RGCs to onset of flashed spots of varying contrast from the background luminance, mean with shadedSD across cells (n = 8 cells).

