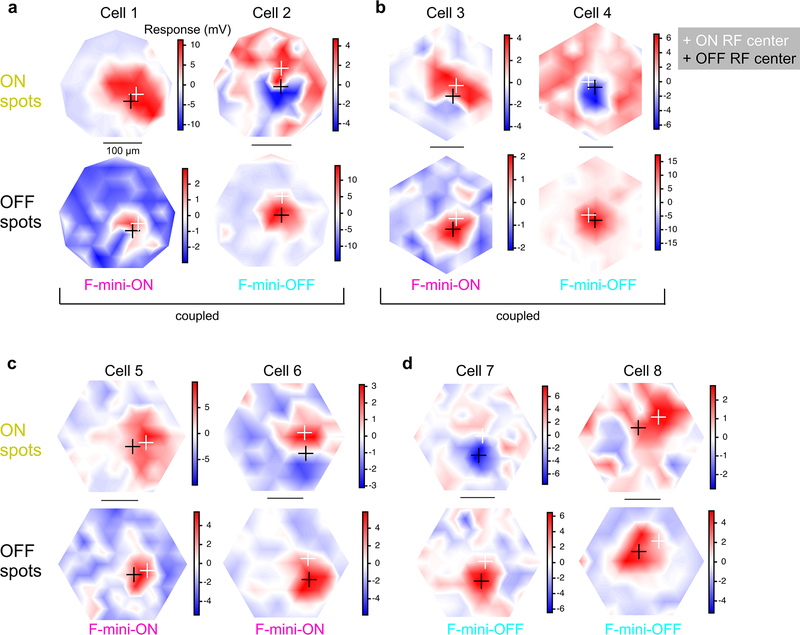
Extended Data Fig. 2. Example RF maps from F-mini-ON and F-mini-OFF RGCs.
Receptive field maps of peak response to 40 μm flashed spots over the RF area, averaged over 2 or 3 repeats. a, A GJ coupled F-mini-ON and F-mini-OFF recorded simultaneously. b, Another such RGC pair. c, Two unconnected F-mini-ON RGCs. d, Two unconnected F-mini-OFF RGCs. On all plots, the cross markers are at the center of mass of responses over the 80th percentile (ON, white; OFF, black). Color scale is in mV change from baseline. All scale bars are 100 μm.

