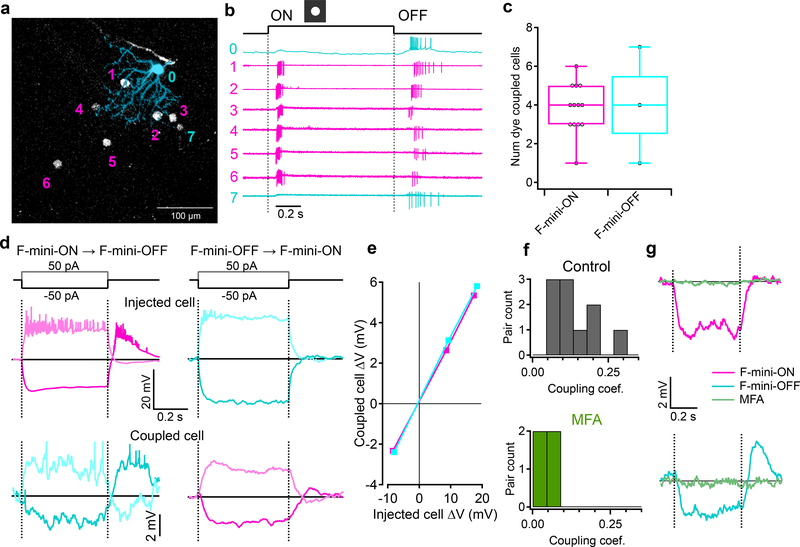
Figure 5. F-mini-ON and F-mini-OFF RGCs are electrically coupled to each other by gap junctions.
a, An example illustrating heterotypic network connectivity. The F-mini-OFF RGC labeled ‘0’ was filled with Alexa Fluor 488 (cyan), revealing 7 coupled somas (white). b, Cell-attached recordings from each of the labeled somas shown in a. Cells 1 through 6 show clear signs of being neighboring F-mini-ON RGCs. The soma of Cell 7 is dimmer, and is likely a second-order connected F-mini-OFF RGC. c, Distribution of the number of dye coupled cells observed in Neurobiotin and Alexa Fluor 488 cell fills of F-mini-ON and F-mini-OFF RGCs, n = 13, 3 cells. d, Average voltage traces from an RGC pair in which one F-mini RGC was injected with current (top row) and the coupled F-mini RGC of the opposite type (bottom row) showed a response. Current injections were +50 pA (lighter traces) and −50 pA (darker traces). e, Voltage change relationship across the electrical synapse in both directions for the pair in d. f, Distribution of the coupling coefficient (slope of line in e) for all recorded pairs, in control conditions (top) and in the presence of MFA (bottom). g, Example of MFA abolishing voltage deflection, showing voltage in F-mini RGCs (for −50 pA injection in coupled cell) in control conditions and in the presence of MFA (green). Image in a is a composite of a maximum projection image of the F-mini-OFF dendrites in cyan with a maximum projection image of the ganglion cell layer in white. Cell ‘0’ in b was recorded in current clamp mode. Box plots in c show maximum, 75th percentile, median, 25th percentile, and minimum.

