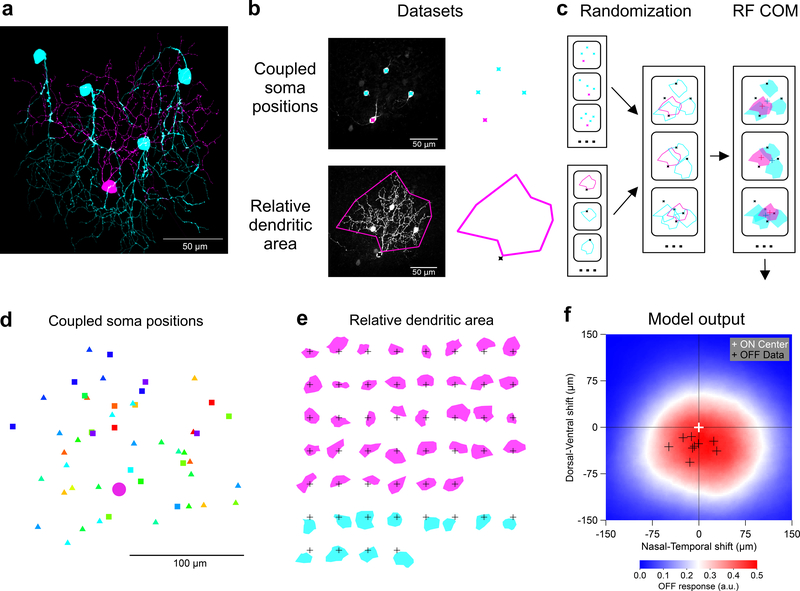
Figure 7. F-mini-ON RGCs RF offset is captured by a morphological model.
a, Traced microscope image from an experiment in which a single F-mini-ON RGC (magenta) was filled with Neurobiotin. Four coupled F-mini-OFF RGCs are in cyan. A spatial offset is apparent in the dendritic arbors of the two cell types relative to the soma of the F-mini-ON. b, Diagram of the imaging datasets used in the morphological model, described in d and e. c, RF model diagram (see Methods). Measurements of F-mini-ON coupled soma positions in d were randomly combined with convex polygon fits to the dendrites of F-mini-ON and F-mini-OFF RGCs in e, to create a purely anatomical prediction of the center-of-mass (COM) offset of ON and OFF RFs (red and blue crosses). d, Locations of labeled somas relative to the injected F-mini-ON RGCs (magenta circle) included both confirmed F-mini-OFF RGCs (squares) and RGC somas that were not further characterized (triangles) (n = 50 somas, 13 injected cells, colored by injected cell) Each point represents the position of a gap-junction labeled soma relative to the position of the filled F-mini-ON RGC. Results above suggest that all coupled cells were in fact F-mini-OFF RGCs, but only some of them (squares) were confirmed via electrophysiology or IHC. e, Area of dendrites relative to soma position for the measured population of F-mini-ON and F-mini-OFF RGCs (n = 38, 12 cells). Soma locations are marked by 50 μm crosses. f, Result from the model. Colored surface is mean OFF RF relative to the centered ON RF. True F-mini-ON RF offset data (black crosses) and format are from Fig. 2g.

