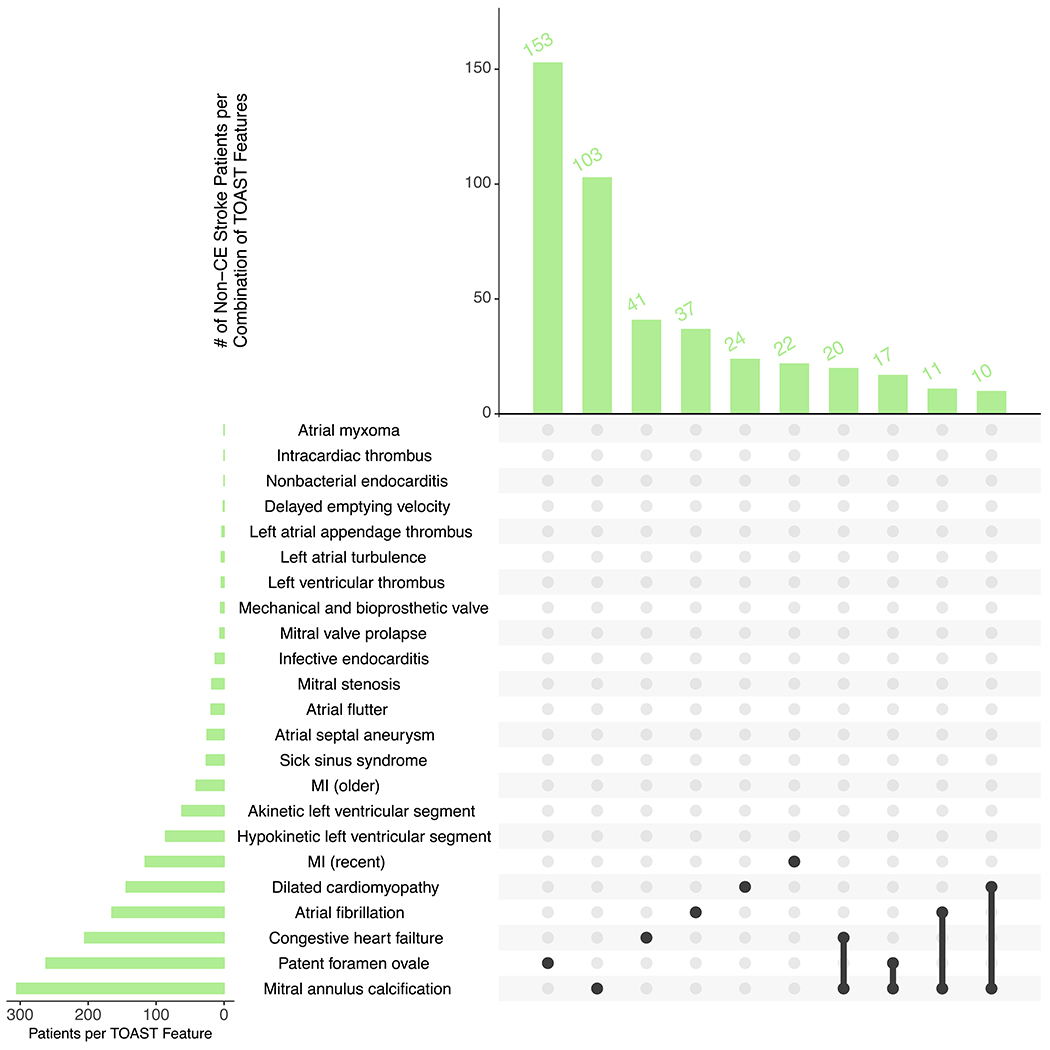
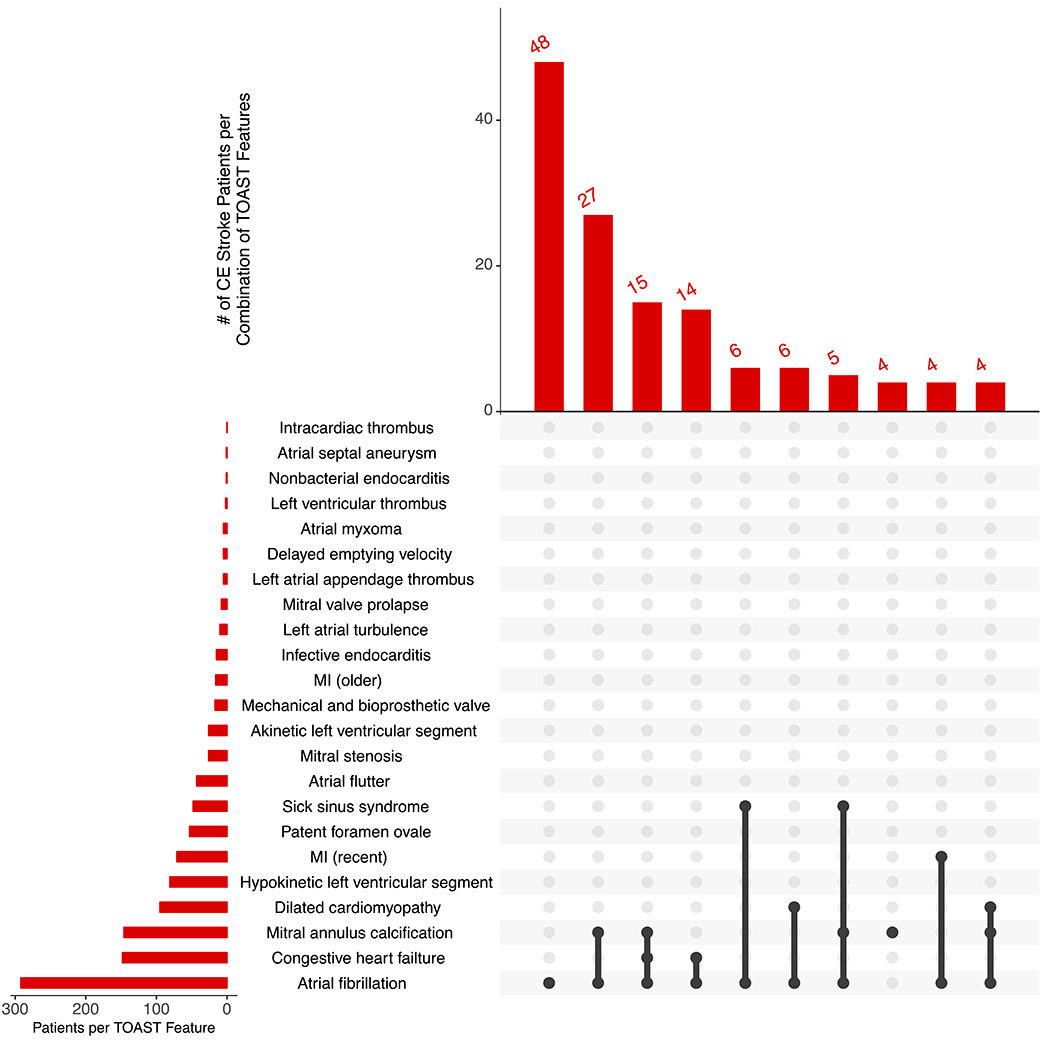
Figure 2.


Frequency of non-CE (A) and CE (B) strokes per combination of TOAST cardioembolic stroke features.
The top UpSet plot depicts overall frequency of the top features for non-CE stroke, and the bottom depicts overall frequency of the top features for CE stroke. Black lines connecting multiple features indicate the presence of a combination of features.
