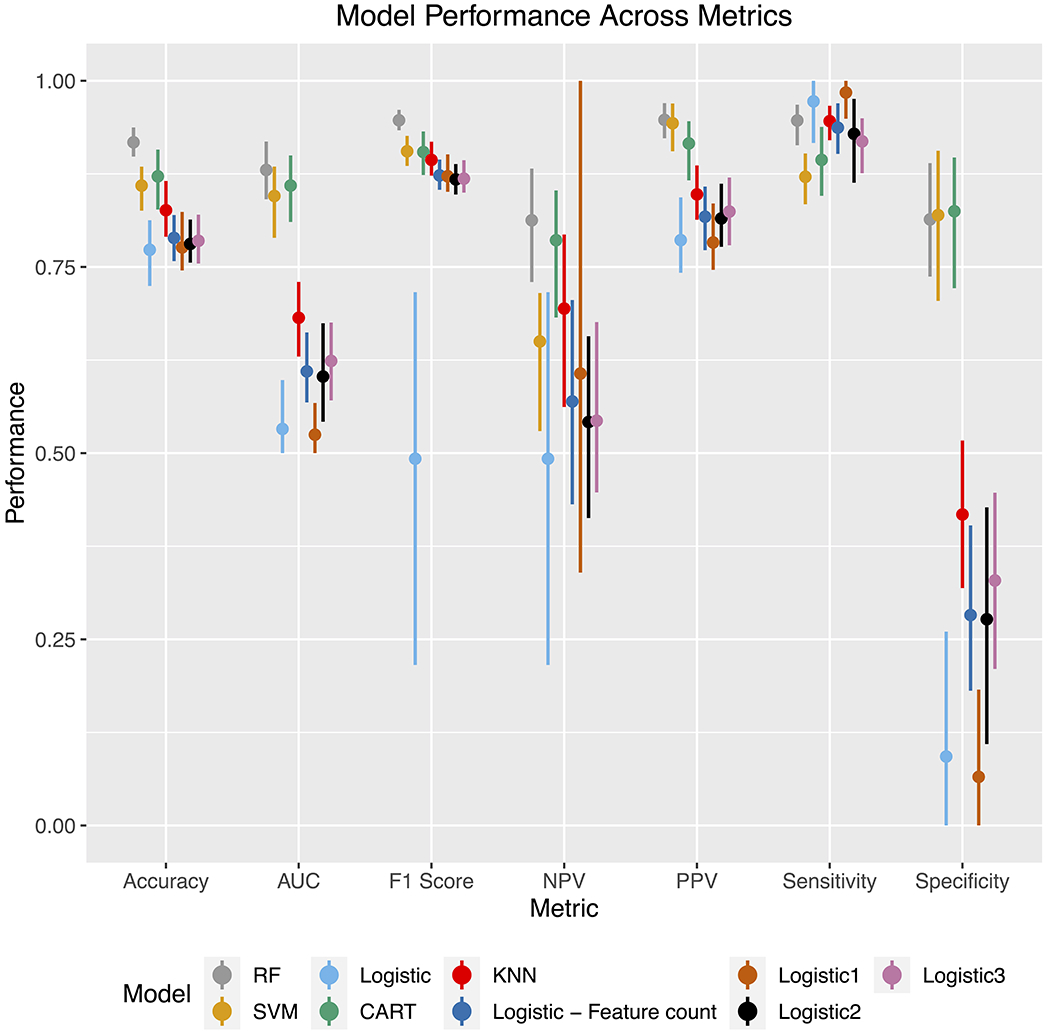
Figure 3.

Performance of various algorithms used for TOAST classification of cardioembolic stroke.
Displayed from left to right are the algorithms with the best to worst performance based on accuracy. SVM denotes “Support Vector Machine”. CART denotes “Classification and Regression Tree”. KNN denotes “K Nearest Neighbors”. “Logistic regression” denotes multivariate logistic regression. “Logistic – feature count” denotes a logistic regression model regressed on the number of features present in the stroke event. “Logistic - ≥ 1 feature” to “Logistic - ≥ 3 feature” models respectively denote a logistic regression model regressed on a binary covariate indicating the presence of 1 or more features to 3 or more features.
