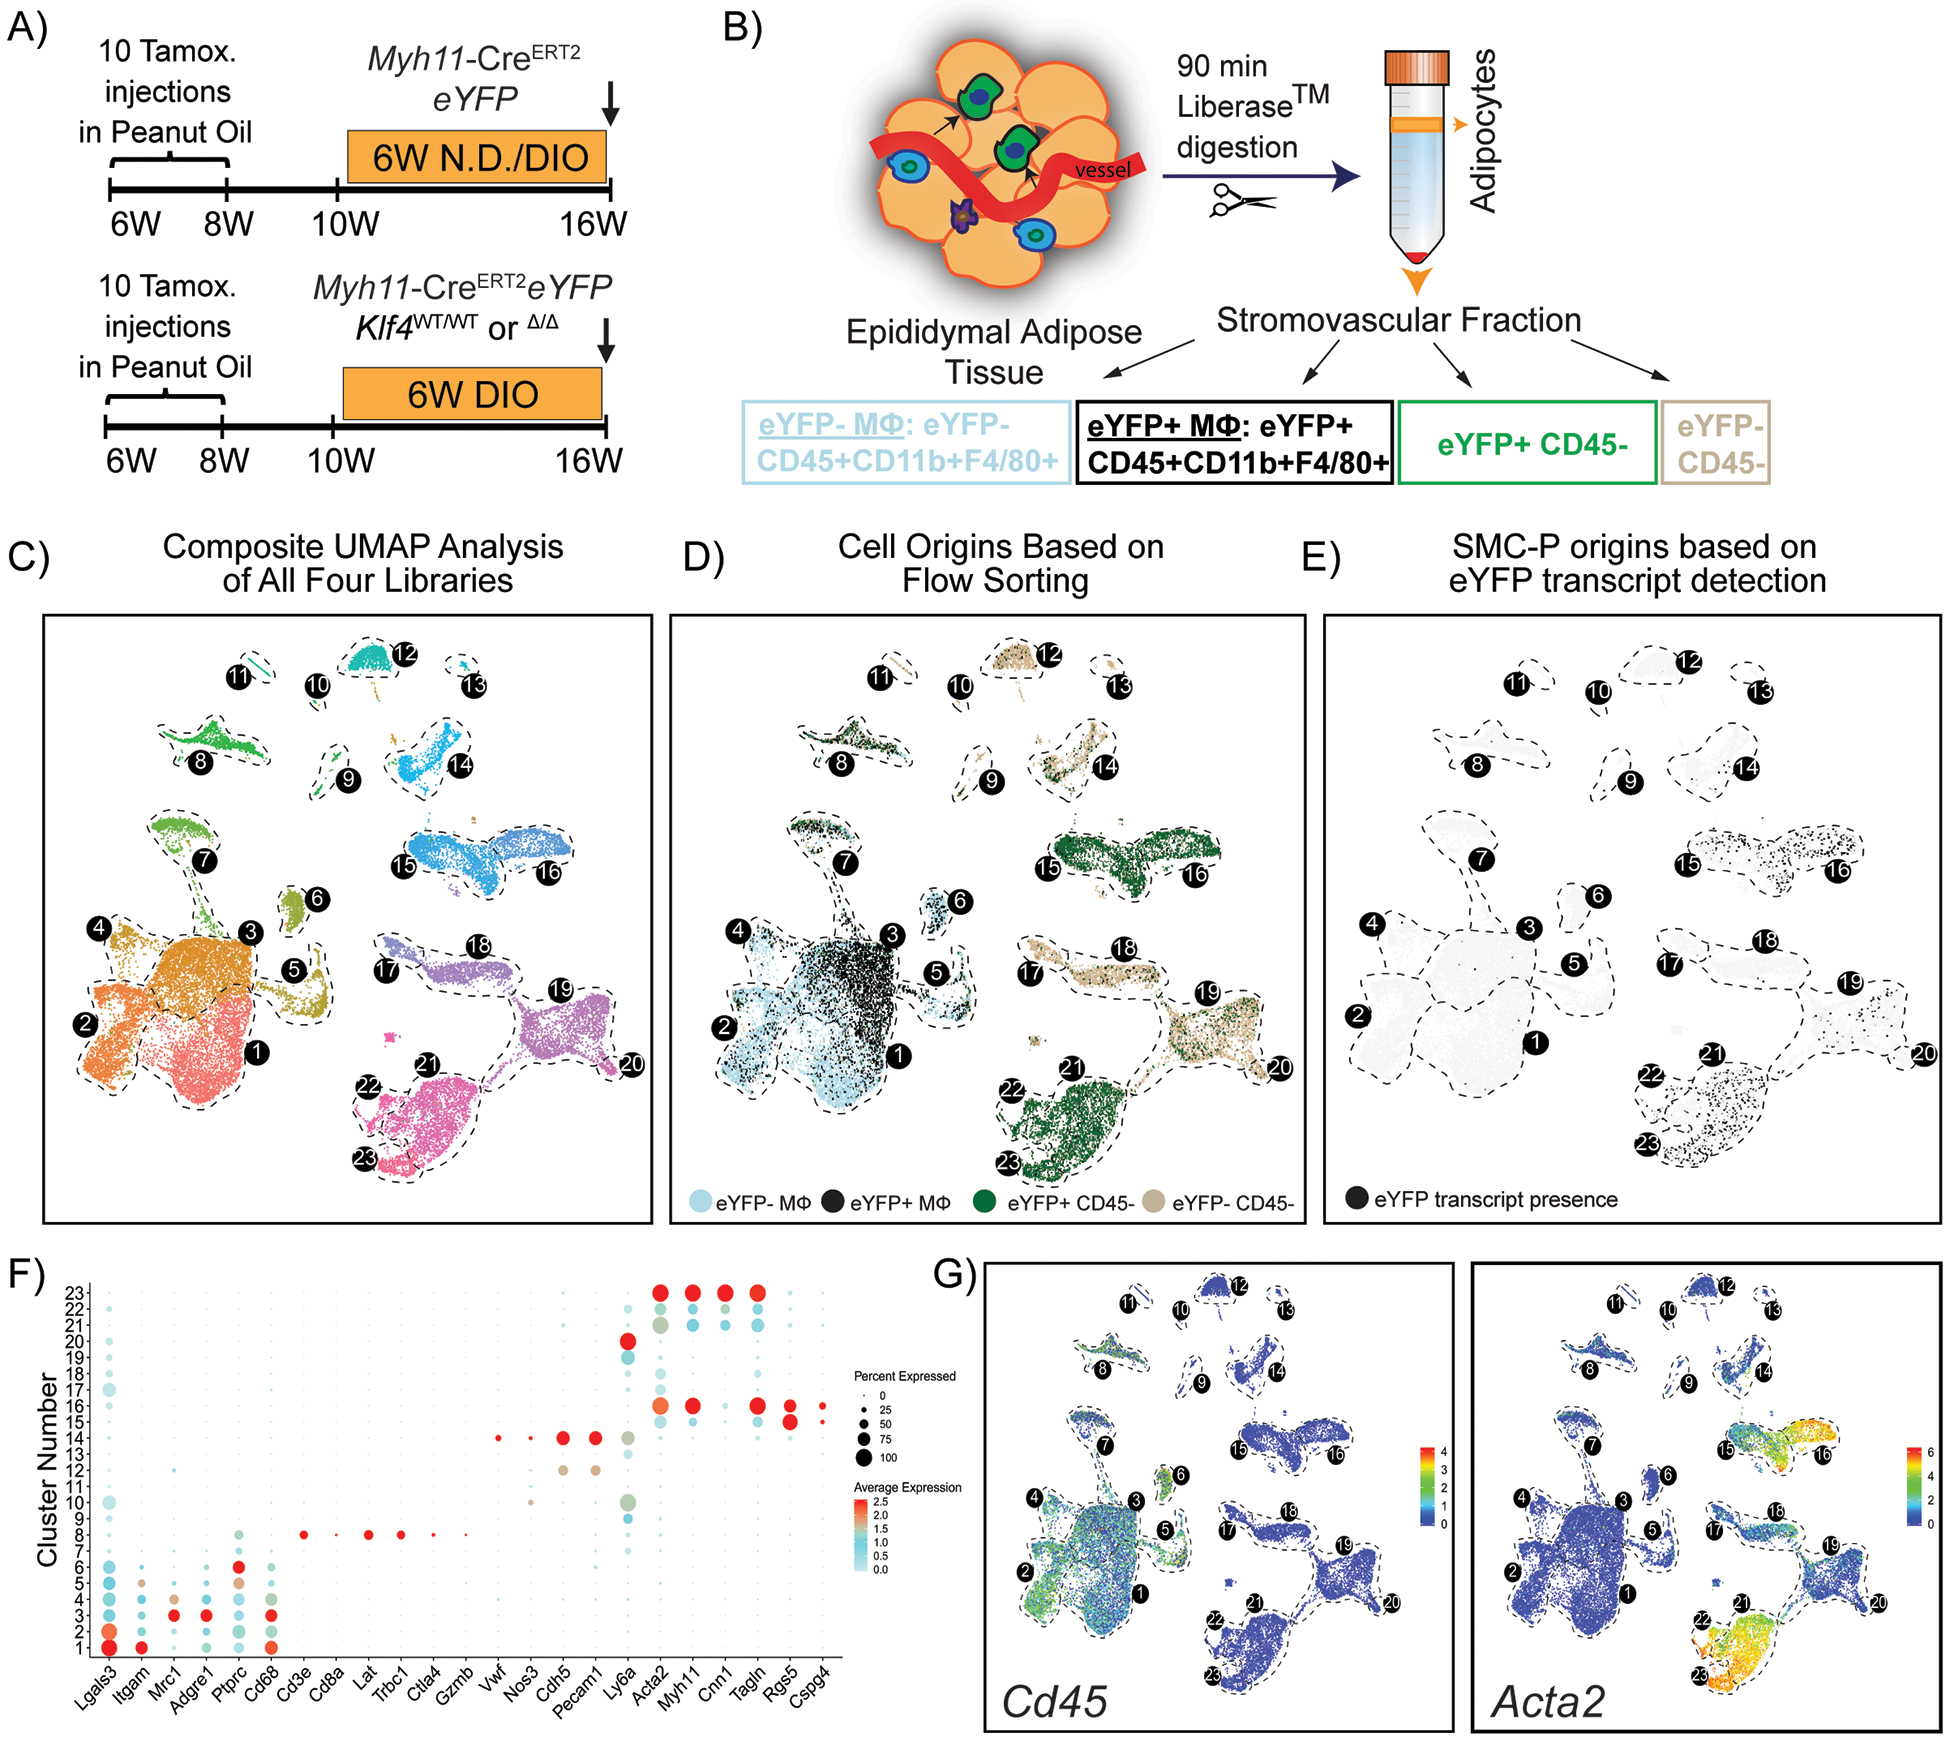
Figure 2: A significant fraction of the flow-sorted eYFP+ cells from Myh11-CreERT2eYFP mice treated with tamoxifen in peanut oil exhibit a MФ transcriptomic signature but have no detectable eYFP transcript expression.

(A) Schematic of the mouse model and experimental design. Four experimental animal groups were analyzed: Myh11-CreERT2eYFP SMC-P lineage-tracing mice on normal diet (Group 1, N.D.), or DIO diet (Group 2, DIO) for 6 weeks, as well as SMC-P Klf4WT/WT mice on DIO diet (SMC-P Klf4WT/WT DIO, Group 3), and SMC-P Klf4Δ/Δ mice on DIO diet (SMC-P Klf4Δ/Δ DIO, Group 4) for 6 weeks. (B) For each experimental group, SVF cells of epididymal adipose tissue were sorted for four cell-type groups, including eYFP+CD45−, eYFP+CD45+CD11b+F4/80+ (eYFP+MФ), eYFP‒CD45+CD11b+F4/80+ (eYFP−MФ), and eYFP−CD45− cells followed by scRNAseq library preparation resulting in a total of 16 libraries. The eYFP FMO gate was set using epididymal SVF cells from a Myh11-CreERT2eYFP control mouse not given IP tamoxifen in peanut oil. (C – E) Integrated UMAP plots of 25,356 cells from four experimental groups: N.D. (4,516 cells), DIO (3,995 cells), SMC-P Klf4WT/WT DIO (8,506 cells), SMC-P Klf4Δ/Δ DIO (8,339 cells). (C) Color-coded UMAP plot of integrated libraries shows 23 clusters. (D) UMAP plot of integrated libraries showing cell distribution based on the sorted cell-types. (E) UMAP feature plot of the eYFP transcript distribution. (F) Dot plot depicting the expression levels and percentages of cells expressing a pre-determined list of traditional marker genes in each cluster. (G) Feature plots showing expression levels of the traditional myeloid cell marker Cd45, and SMC marker Acta2.
