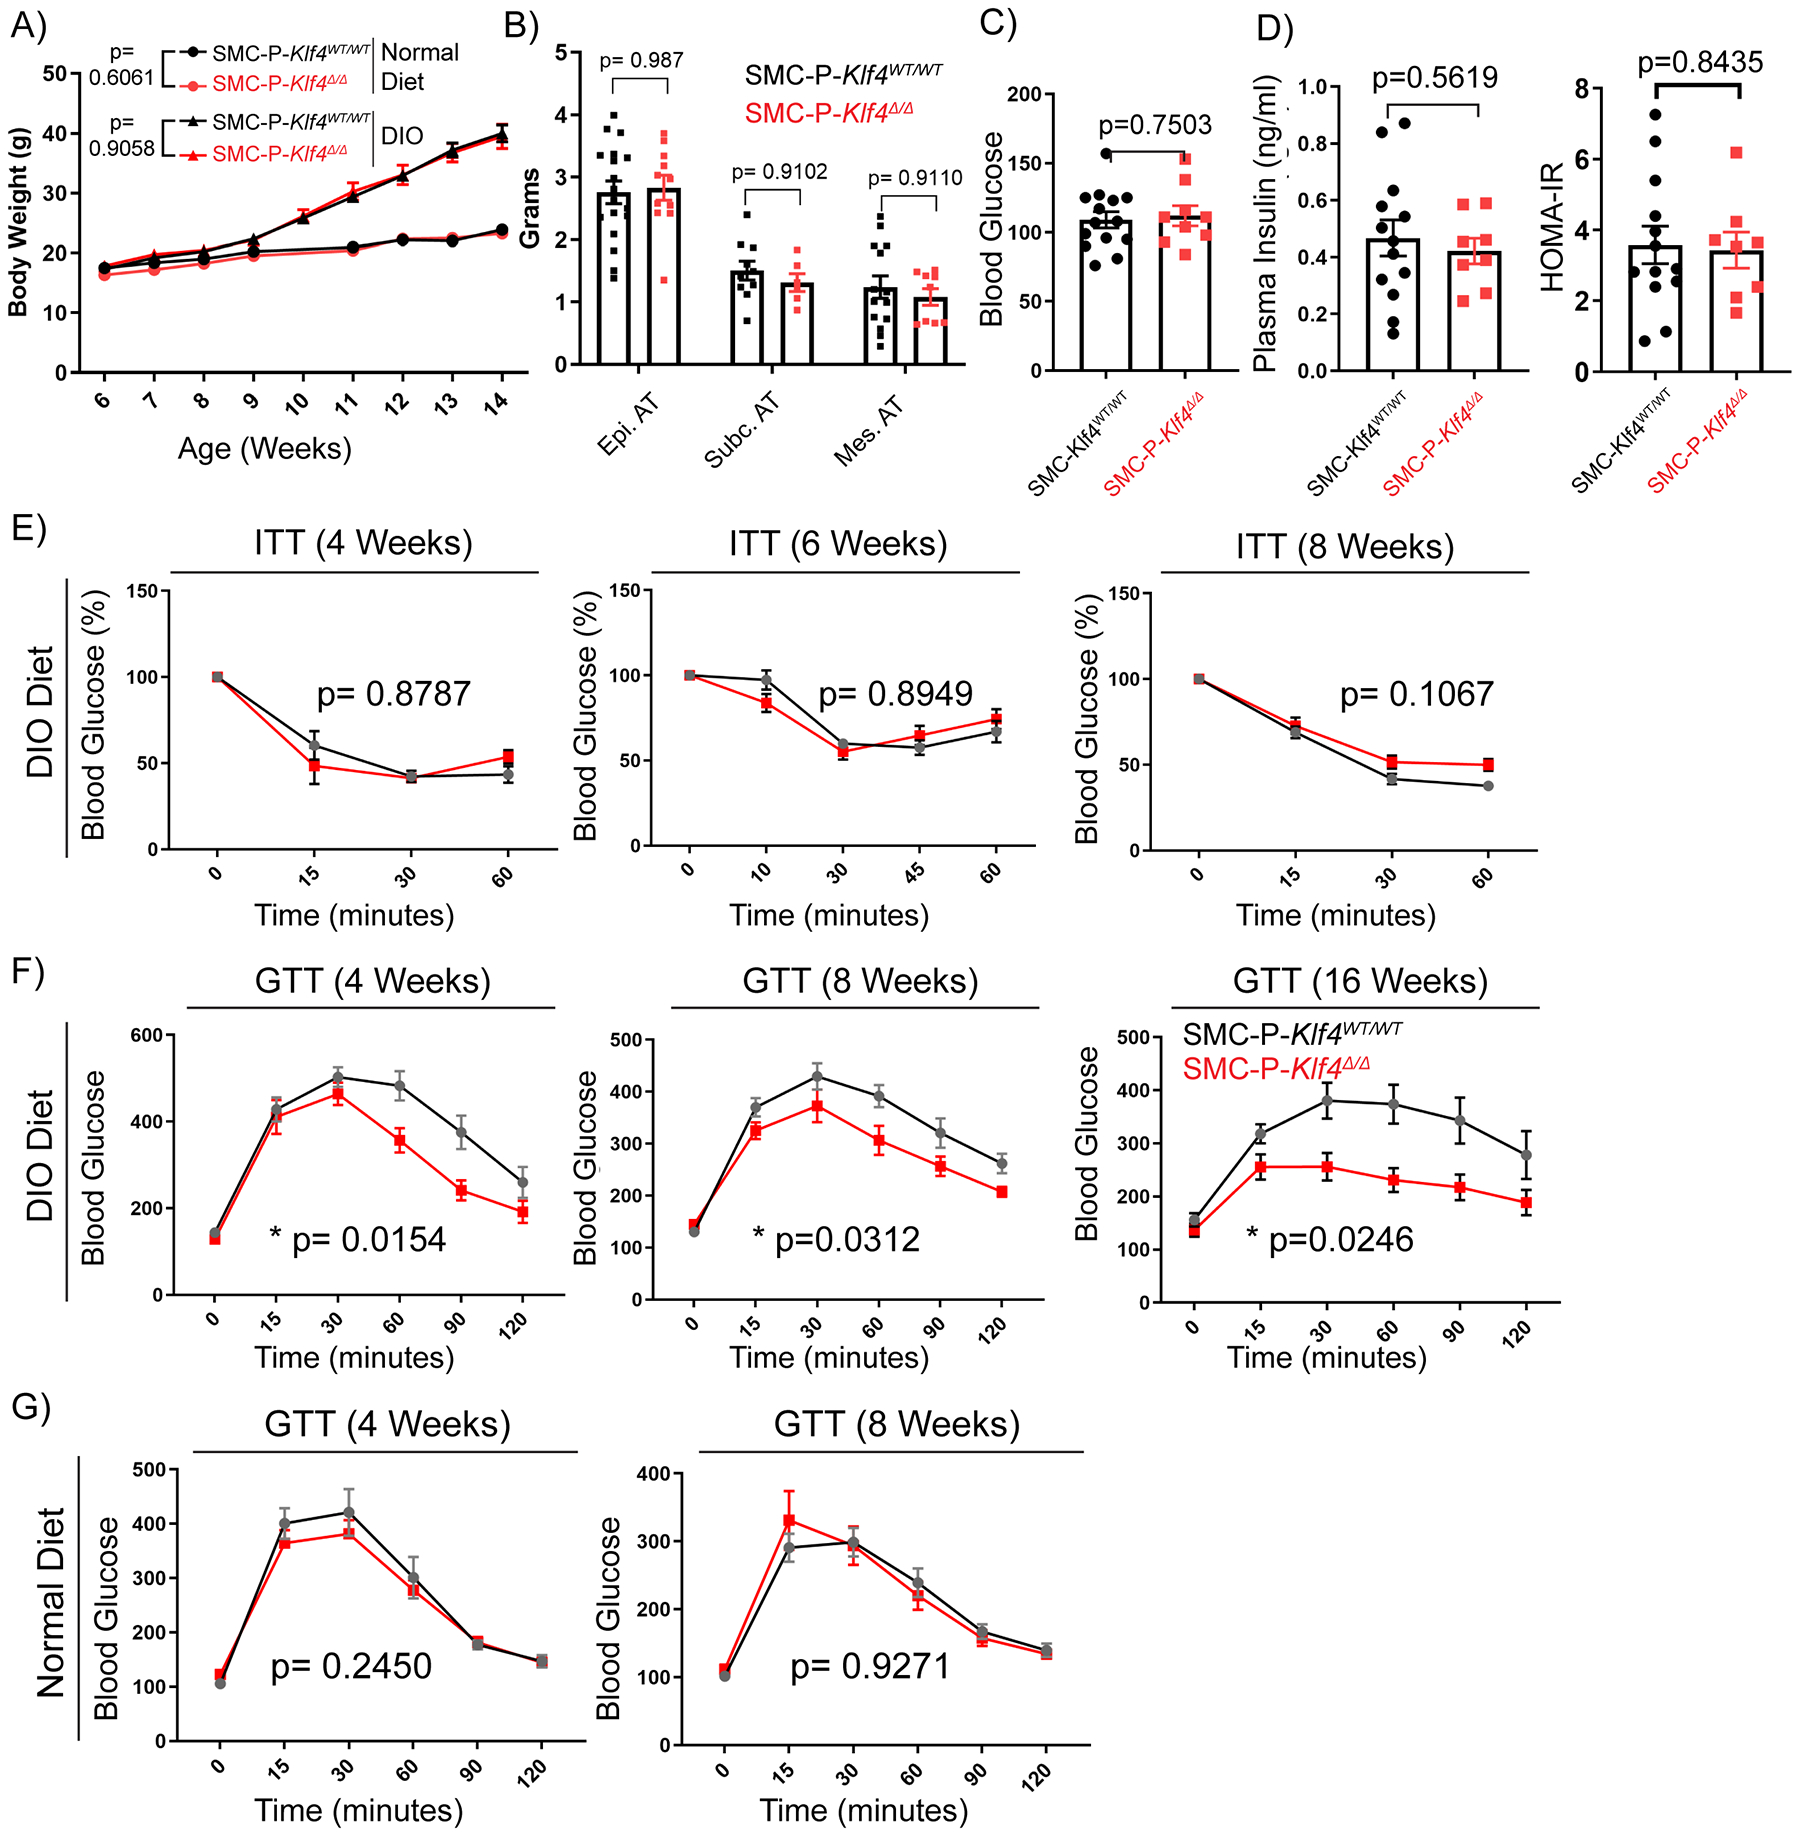
Figure 5: SMC-P Klf4Δ/Δ mice are not resistant to DIO, but display improved glucose tolerance.

SMC-P Klf4WT/WT and SMC-P Klf4Δ/Δ mice were injected with tamoxifen in peanut oil between 6 – 8 weeks of age, followed by a 2-week washout period, and then fed either a normal diet or DIO diet for six weeks. (A) Graph of body weight changes over time (weeks of age) for SMC-P Klf4WT/WT and SMC-P Klf4Δ/Δ mice showing mean ± SEM N.D.: SMC-P Klf4WT/WT n = 4, SMC-P Klf4Δ/Δ n = 5; DIO: SMC-P Klf4WT/WT n = 11, SMC-P Klf4Δ/Δ n = 11. No significant differences were observed between genotypes using two-way repeated measures ANOVA, P values as indicated. (B) Adipose tissue weights of mice receiving 6–7 weeks of high fat diet were plotted (mean ± SEM). P values were determined using an ordinary Two-way ANOVA with alpha=0.05 followed by Sidak’s multiple comparisons post-test. No significant differences were observed between genotypes (P values given above bar graphs). (C) SMC-P Klf4WT/WT (n = 14) or SMC-P Klf4Δ/Δ (n = 9) mice were injected with tamoxifen in peanut oil and fed high fat diet for six weeks. After overnight fasting, plasma glucose levels were measured (mean ± SEM). An unpaired two-tailed Welch’s t-test, with alpha = 0.05 without assuming a consistent standard deviation yielded P=0.7503 (D) Plasma insulin levels were measured using the STELLUX® Chemi Rodent Insulin ELISA after six weeks of DIO feeding followed by overnight fasting (SMC-P Klf4WT/WT n = 13; SMC-P Klf4Δ/Δ n = 8). HOMA-IR is calculated by multiplying fasting plasma insulin (μU/ml) by fasting blood glucose (mM) and dividing by 22.5. Values represent mean ± SEM. An unpaired two-tailed Welch’s t-test, with alpha = 0.05 without assuming a consistent standard deviation yielded P=0.5619 for plasma insulin, P=0.8435 for HOMA-IR. (E) SMC-P Klf4WT/WT and SMC-P Klf4Δ/Δ mice were injected with tamoxifen in peanut oil followed by a 2-week washout period, and then fed DIO diet for indicated times. Then mice were subjected to insulin tolerance tests (ITT) under random-fed conditions at 2 pm. Blood glucose values were plotted as percent of values at time 0. Values represent means ± SEM. (ITT 4-weeks DIO: SMC-P Klf4WT/WT n = 5, SMC-P Klf4Δ/Δ n = 2; ITT 6-weeks DIO: SMC-P Klf4WT/WT n = 4, SMC-P Klf4Δ/Δ n = 10; ITT 8-weeks DIO: SMC-P Klf4WT/WT n = 4, SMC-P Klf4Δ/Δ n = 7). (F) SMC-P Klf4WT/WT and SMC-P Klf4Δ/Δ mice were injected with tamoxifen in peanut oil and fed DIO diet for indicated times. They were then subjected to glucose tolerance tests (GTT) following overnight fasting. Values represent means ± SEM. (GTT 4-weeks DIO: SMC-P Klf4WT/WT n = 10, SMC-P Klf4Δ/Δ n = 10; GTT 8-weeks DIO: SMC-P Klf4WT/WT n = 10, SMC-P Klf4Δ/Δ n = 11; GTT 16-weeks DIO: SMC-P Klf4WT/WT n = 8, SMC-P Klf4Δ/Δ n = 5.) (G) Similar to D, GTT were performed with mice fed a normal diet for indicated times. GTT 4-weeks Normal Diet: SMC-P Klf4WT/WT n = 9, SMC-P Klf4Δ/Δ n = 8; GTT 8-weeks Normal Diet: SMC-P Klf4WT/WT n = 11, SMC-P Klf4Δ/Δ n = 9. Statistical analysis for (E, F and G): For GTT and ITT, repeated measures two-way ANOVA with the Geisser-Greenhouse correction was used for comparing data between genotypes, P values are indicated in plots.
