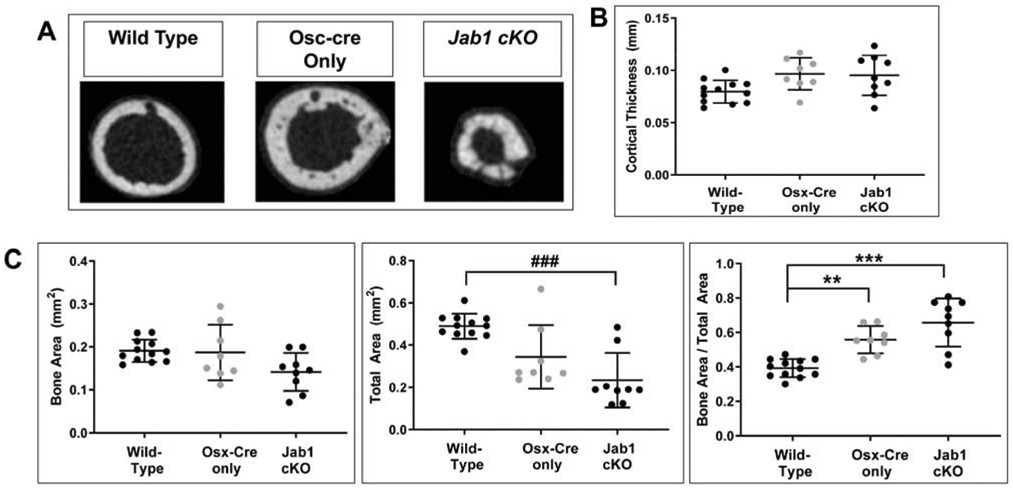
Figure 5. Loss of Jab1 in osteoblast precursors led to increased cortical thickness and cortical bone fraction.

(A) The μCT quantification of cortical thickness. (B) The μCT quantification of cortical bone area (BA), total cross sectional area (TA), and cortical bone fraction (BA/TA). Wild type, n = 12; Osx-cre only, n = 8; Jab1 cKO, n = 9. For parametric analyses, * p < 0.05, ** p < 0.01, *** p < 0.001 by one-way ANOVA with post-hoc analysis by Bonferroni’s multiple comparisons test. For non-parametric analyses, ### p < 0.001 by Kruskal-Wallis one-way ANOVA with post-hoc analysis by Dunn’s multiple comparisons test.
