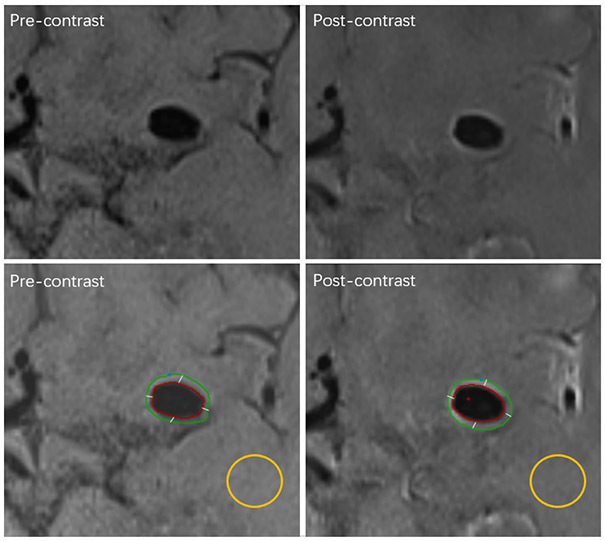
Figure 1.
Example case for image processing. First row, the original images. Second row, the contours of the aneurysm wall and the ROI (region of interests) of the white matter for normalization in calculation. The left column shows the pre-contrast vessel wall images on which the contour of ROI was traced manually, and the right column shows the post-contrast vessel wall images on which the contour of ROI was matched automatically, and the contour of ROI was segmented into quarters automatically.

