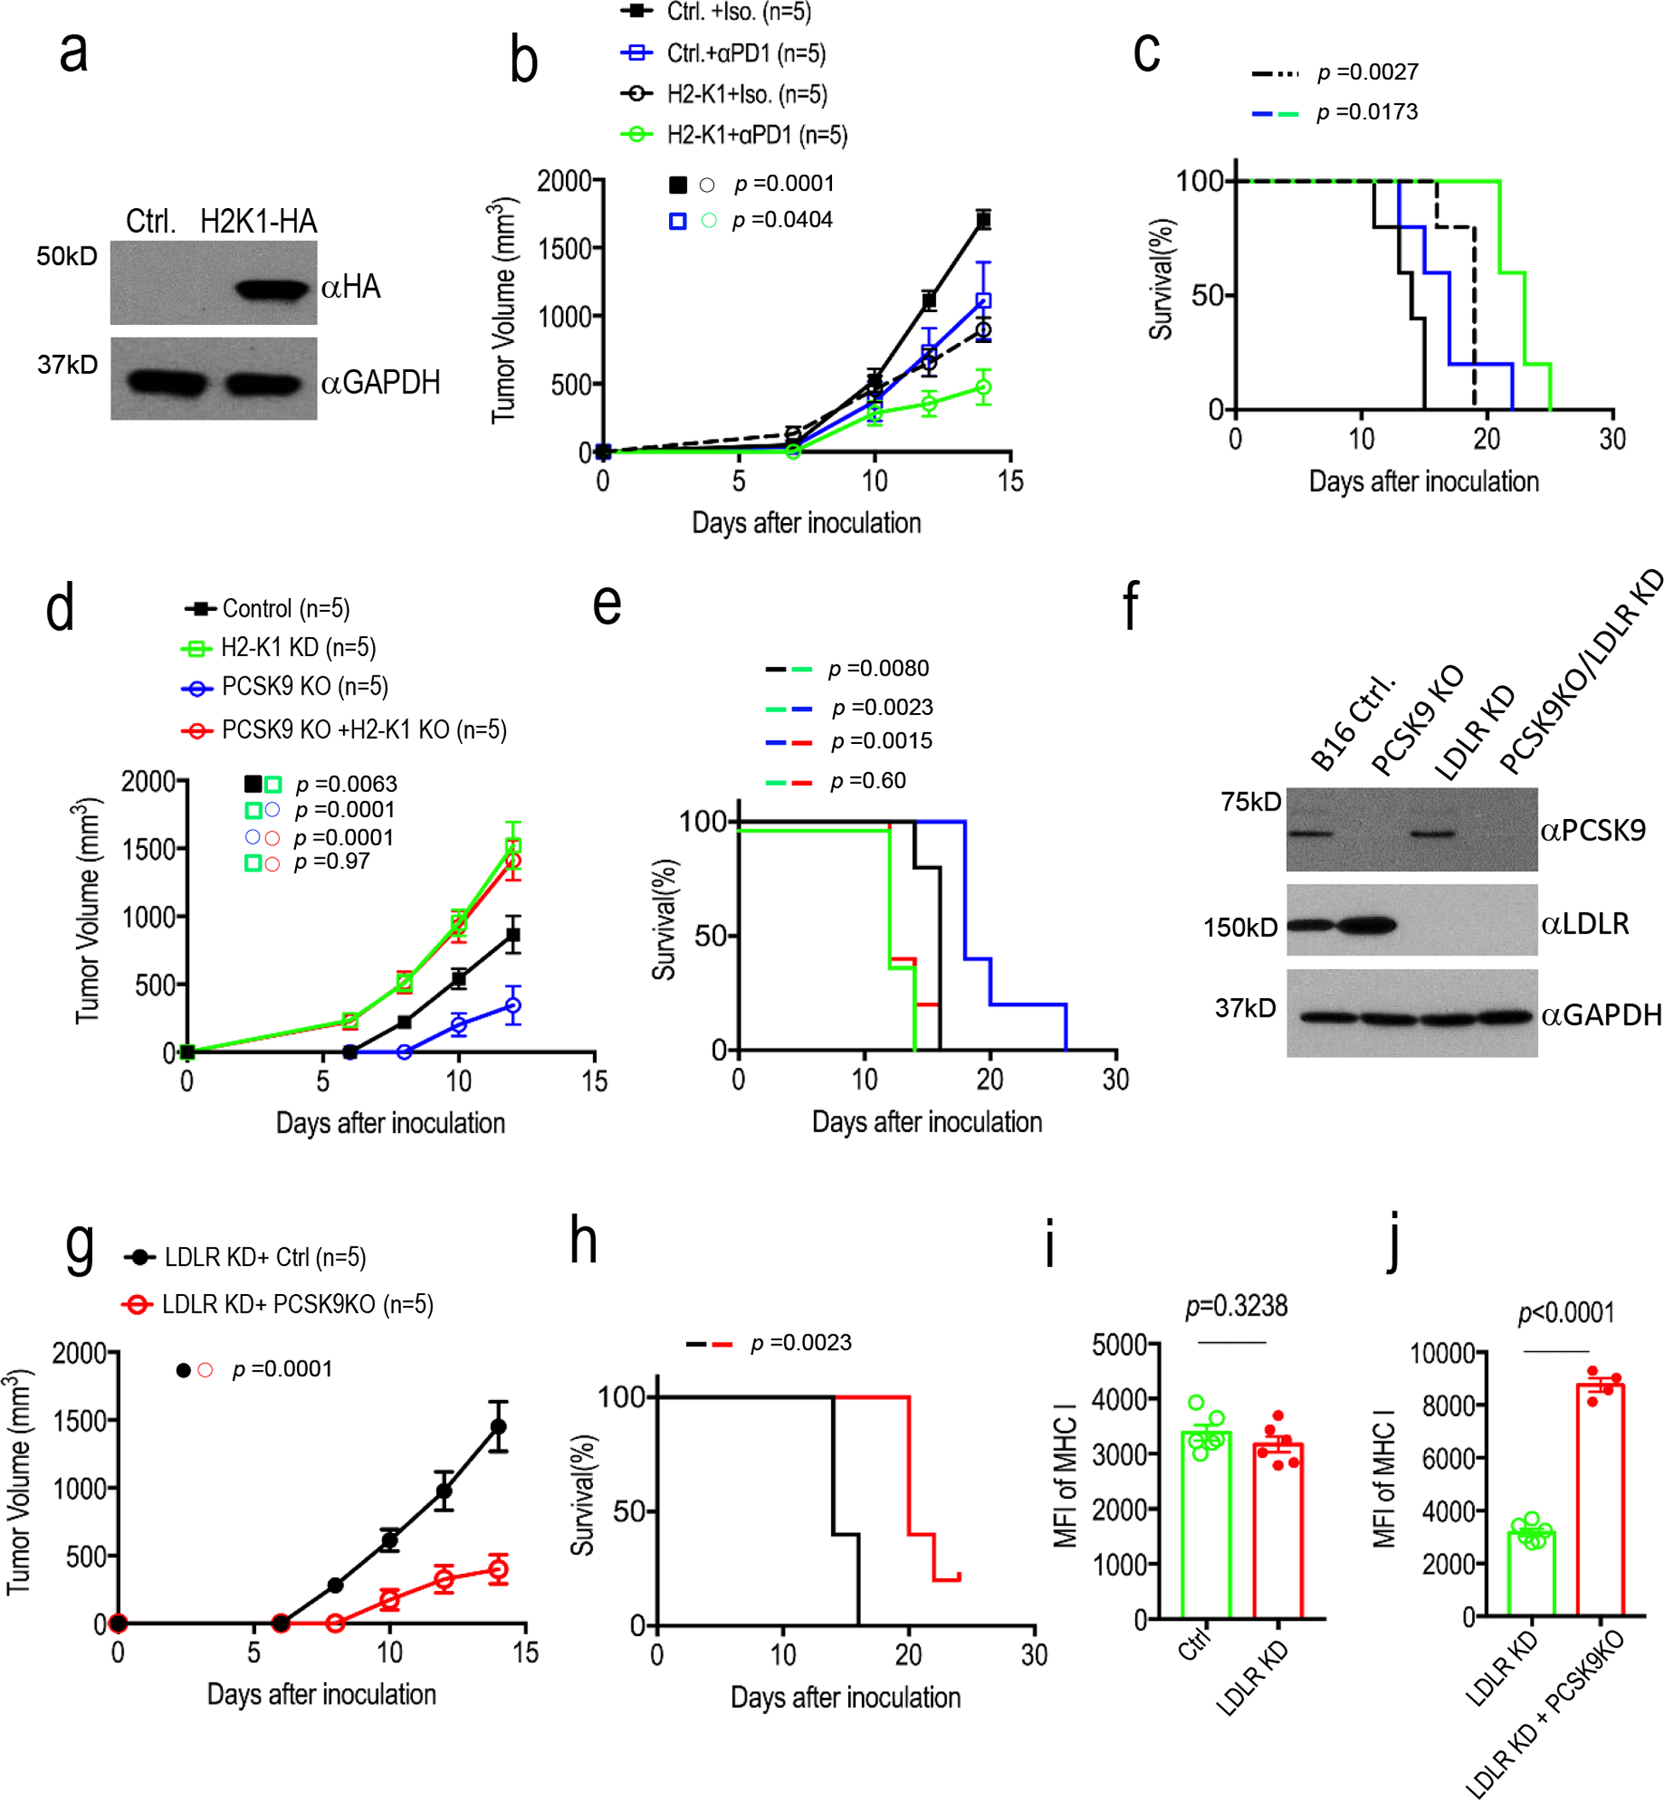
Extended Data Fig. 8. Additional data on the analysis of PCSK9, H2-K1, and LDLR in murine tumor cells.

a. Lentivirus mediated over-expression of HA-tagged H2-K1 gene in B16F10 cells as determined by western blot analysis. The analysis was done once. b-c. Tumor growth delay (b) and Kaplan-Meier survival curve (c) of tumor-bearing C57BL/6 mice implanted with vector control or H2-K1 over-expression B16F10 cells. Error bars, mean ± S.E.M. n=5 tumors in each group. P values in b and c were determined by two-way ANOVA and log-rank test, respectively. d-e. Tumor growth delay (d) and Kaplan-Meier survival curves (c) in mice injected with vector control, H2-K1 KD, PCSK9 KO, or H2-K1KD/PCSK9KO B16F10 cells. n=5 mice per group. Error bars, mean ± S.E.M. P values were determined by two-way ANOVA and log-rank test, respectively. f. Western blot analysis of and LDLR knockdown in control and PCSK9KO B16F10 tumor cells. The analysis was done once. g-h. Tumor growth delay (g) and Kaplan-Meier survival curves (h) from LDLRKD and LDLRKD/PCSK9KO B16F10 tumors. n=5 mice per group. Error bars, mean ± S.E.M. P values were determined by two-way ANOVA and log-rank test, respectively. i. Flow cytometry analysis of MHC I expression in tumors formed from tdTomato-labeled control and LDLRKD B16F10 cells. n=6 biologically independent tumors. Error bars, mean ± S.E.M. P value calculated by unpaired two-sided t-test. j. Flow cytometry analysis of MHC I expression in tumors formed from tdTomato-labeled LDLRKD (n=6) and LDLRKD/PCSK9KO cells (n=4). Error bars, mean ± S.E.M. P value calculated by unpaired two-sided t-test.
