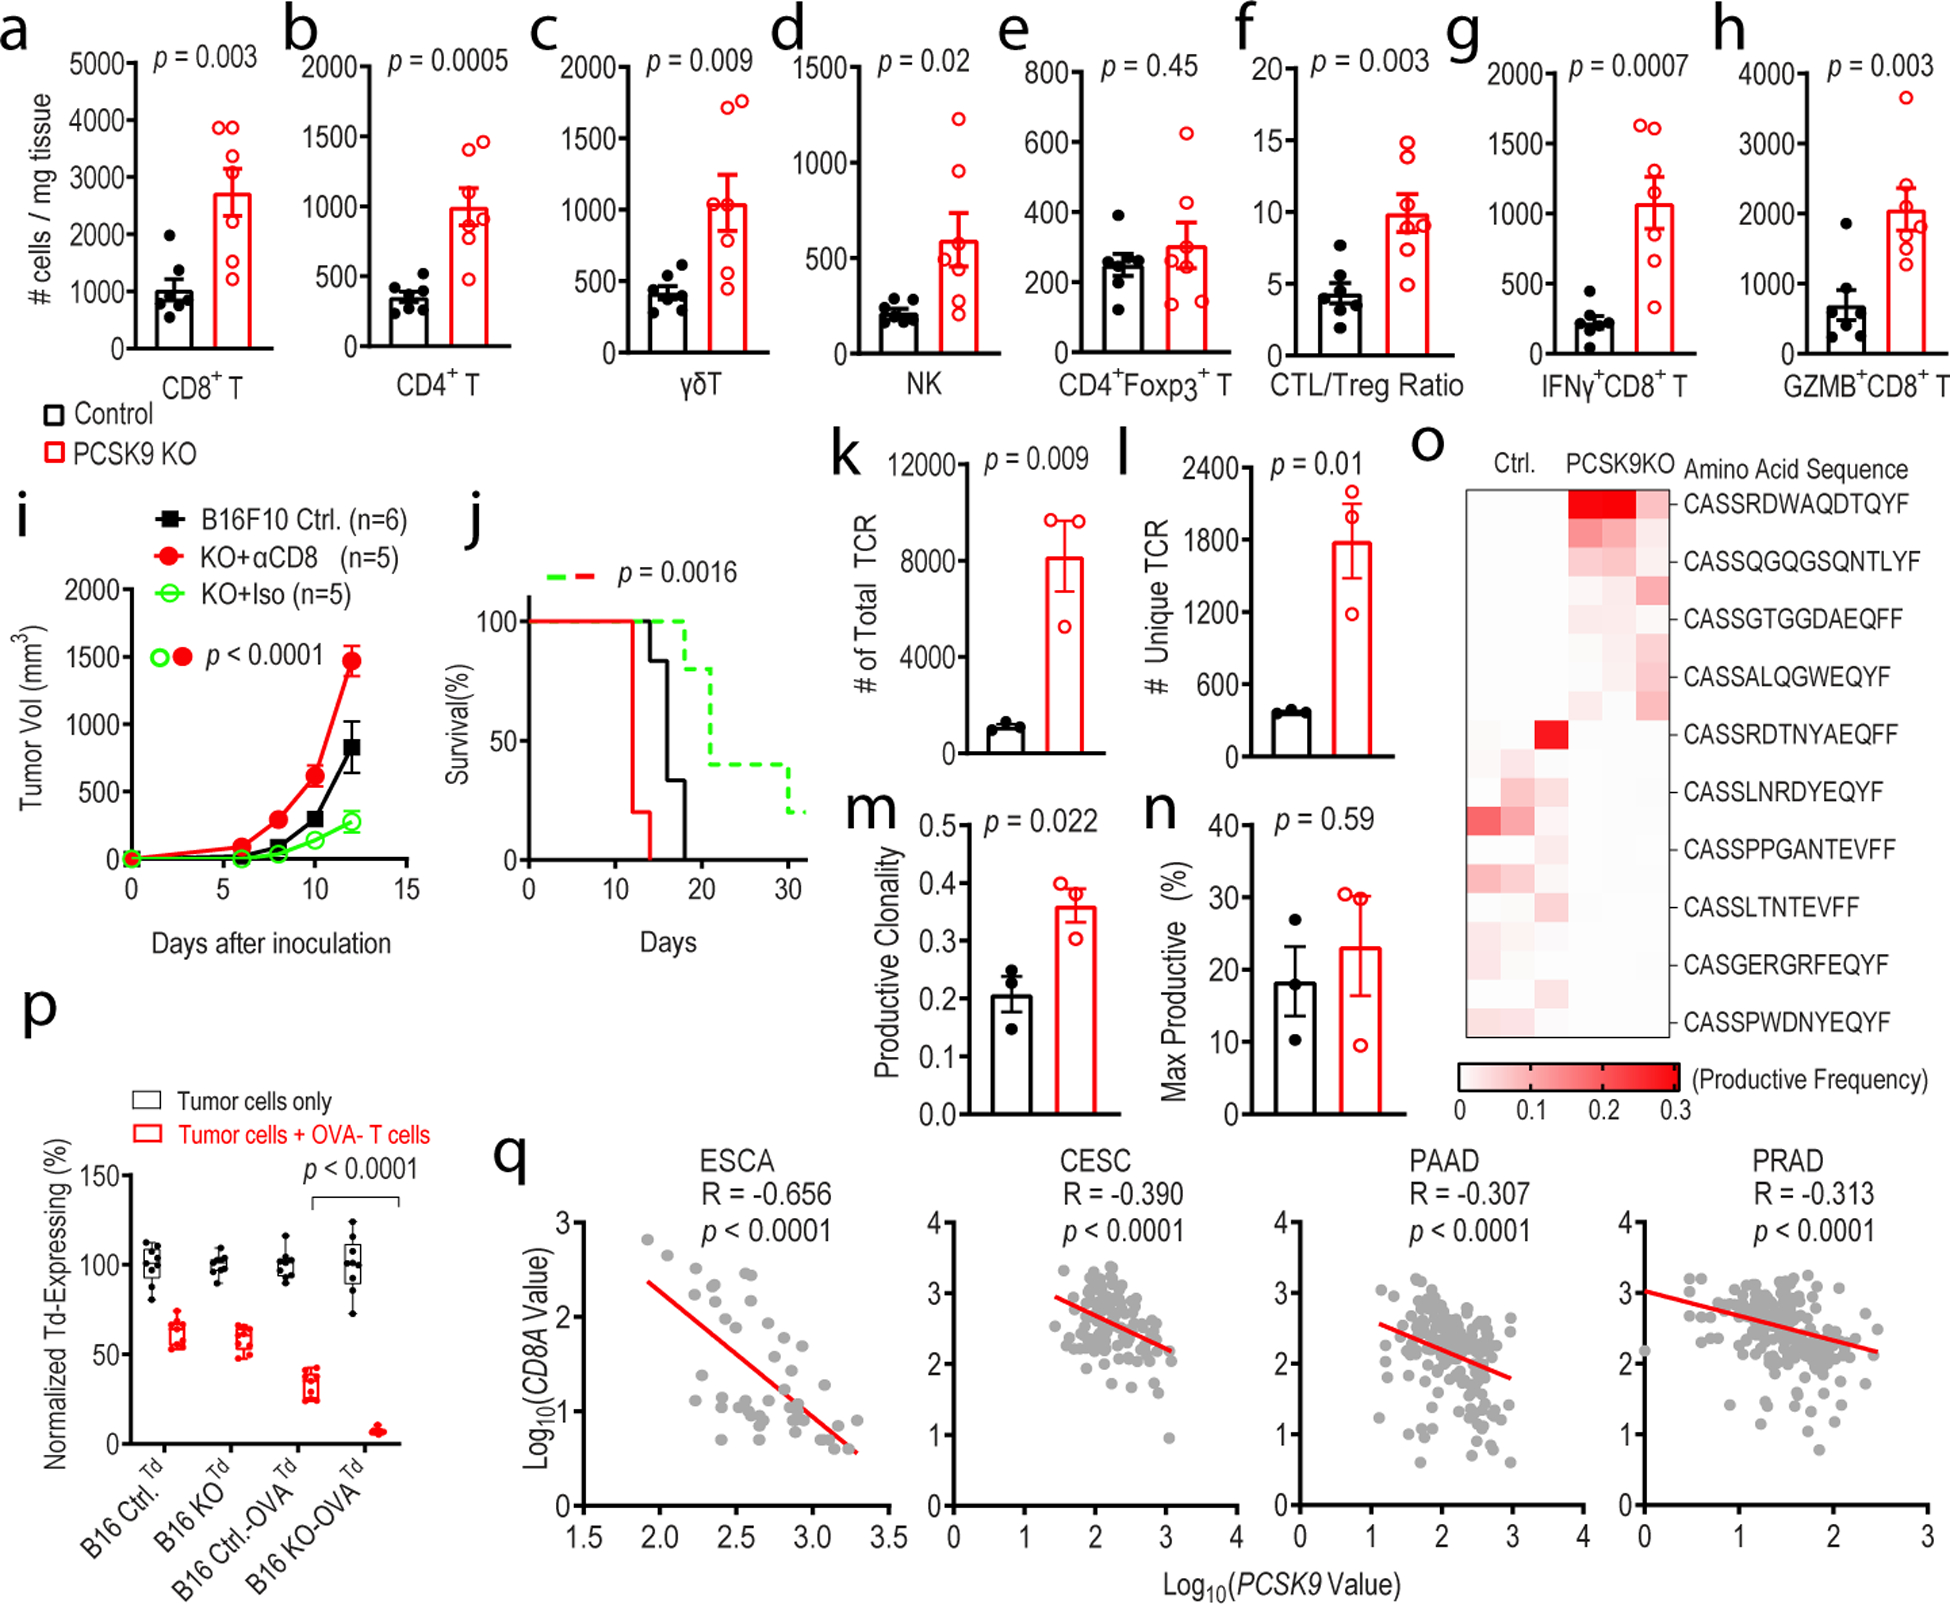
Fig.3. depletion enhances intratumoral T-cell infiltration.

a-e. Quantitative estimate of various immune effector cells per mg of tumor tissue in vector control and PCSK9KO B16F10 tumors as determined by flow cytometry. n=7 tumors per group. f. Ratio of CD8+ T /CD4+Foxp3+ Treg cells in control and PCSK9KO B16F10 tumors. n=7 tumors per group. g-h. Average numbers of tumor-infiltrating IFNγ+ CD8+ T (g) and Gzmb+CD8+T (h) cells per mg of tumor tissue in control or PCSK9 KO tumors. n=7 tumors per group. i-j. Tumor growth (i) and host survival (j) from control and PCSK9KO B16F10 tumor cells in C57BL/6 mice depleted of CD8+ T cells. n=6, 5, 5 tumors in the three groups. k-o. Total TCR (k), unique TCR (l), productive clonality (m), and max productive frequency (n), and heatmap of top 5% TCR (o) in control and PCSK9 knockout tumors by use of TCRB CDR3 sequencing. n=3 tumors per group. p. Quantitative estimates of the fraction of live control or PCSK9KO B16F10-tdTomato tumor cells remaining after 24 hrs of incubation with activated OVA-specific T cells. n=3 biologically independent samples per group. Three representative fields from each sample were counted. q. Negative correlation of PCSK9 mRNA levels with that of CD8A mRNA levels in human esophageal carcinoma (ESCA, 47 samples), cervical squamous cell carcinoma and endocervical adenocarcinoma (CESC,112 samples), pancreatic adenocarcinoma (PAAD,173 samples), prostate adenocarcinoma (PRAD, 313 samples). Data from the GENT database. R represents Pearson correlation coefficient. Error bars represent mean ± S.E.M throughout the figure. P values in a-h, k-n, and p were calculated by unpaired two-sided t-test. P values in i and j determined by two-way ANOVA and log-rank test, respectively. P values in q were calculated by F test.
