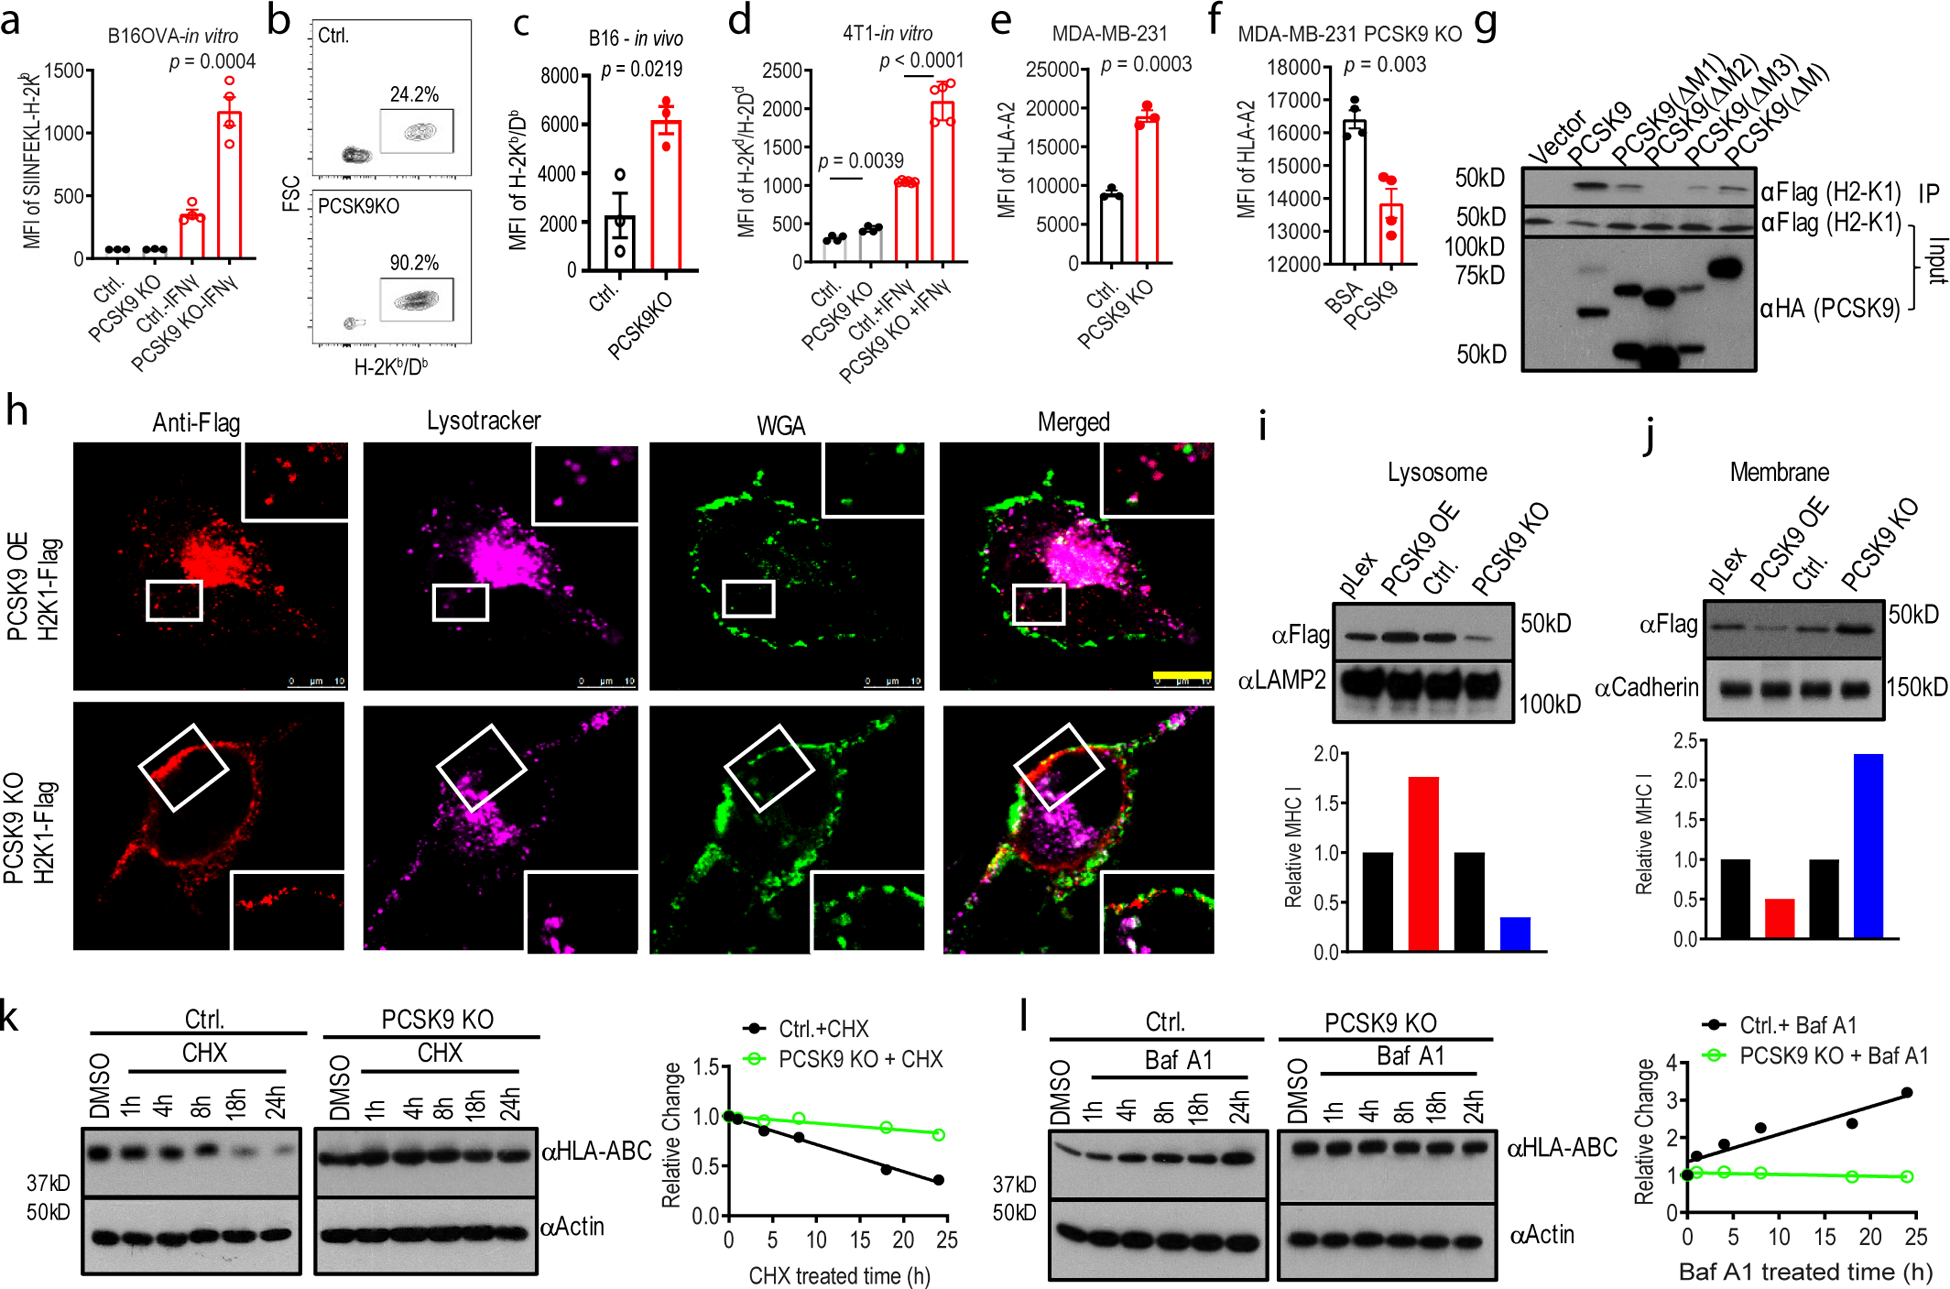
Fig. 4. PCSK9 promotes lysosome-mediated degradation of MHC I in tumor cells.

a. Quantitative estimates of SIINFEKL-H-2Kb levels in B16F10-OVA cells with or without IFNγ treatment in control and PCSK9KO B16F10 cells. n=4,4,6,5 biologically independent samples, respectively. b-c. Flow cytometry estimates of H-2Kb/Db levels on the surface of subcutaneously grown control and PCSK9-deficient B16F10 cells. n=3 tumors per group. d. Quantitative estimate of MHC I levels on the surface of in tissue cultured control and PCSK9-deficient 4T1 cells treated with or without IFNγ. n=5 biologically independent samples. e. The effect of PCSK9 deficiency on HLA-A2 expression on the surface of control and PCSK9KO MDA-MB-231 cells. n=3 biologically independent samples. f. The effect of exogenous PCSK9 protein on HLA-A2 degradation on the surface of MDA-MB-231 PCSK9KO cells. n=4 biologically independent samples. g. Interaction of mouse PCSK9 and H2-K1 in 293T cells were transduced with FLAG-tag labeled H2-K1 gene in combination with HA-tag labeled full-length or various deleted PCSK9 genes. h. PCSK9-promoted H2-K1 migration into the lysosome. Representative fluorescence confocal images of MHC I (H2-K1Flag) distribution in PCSK9 (PCSK9-HA) over-expressing (top panels) or PCSK9 KO (lower panels) B16 F10 cells. Scale bar: 10 μm. Insets showed magnified areas with additional details of co-localization. i-j. Western blot quantification of H2-K1-Flag in the lysosome (i) and plasma membrane (j) fractions of PCSK9 overexpressing (PCSK9-OE) and PCSK9KO B16F10 cells. Bottom panels are the quantitative estimates of MHC I (H2-K1-Flag) expression levels based on data in the top panels. k-l. Western blot analysis of HLA-ABC expression in cycloheximide (CHX, k)- and bafilomycin A1 (BafA1, l)-treated vector control and PCSK9KO MDA-MB-231 cells. In k and l, the right panels showed the quantitative estimates of HLA-ABC levels based on WB analysis. Error bars in a-f, mean ± S.E.M. P values in a-f were determined by unpaired two-sided t test. Two independent experiments were done with similar results for g-l.
