
Figure 6.
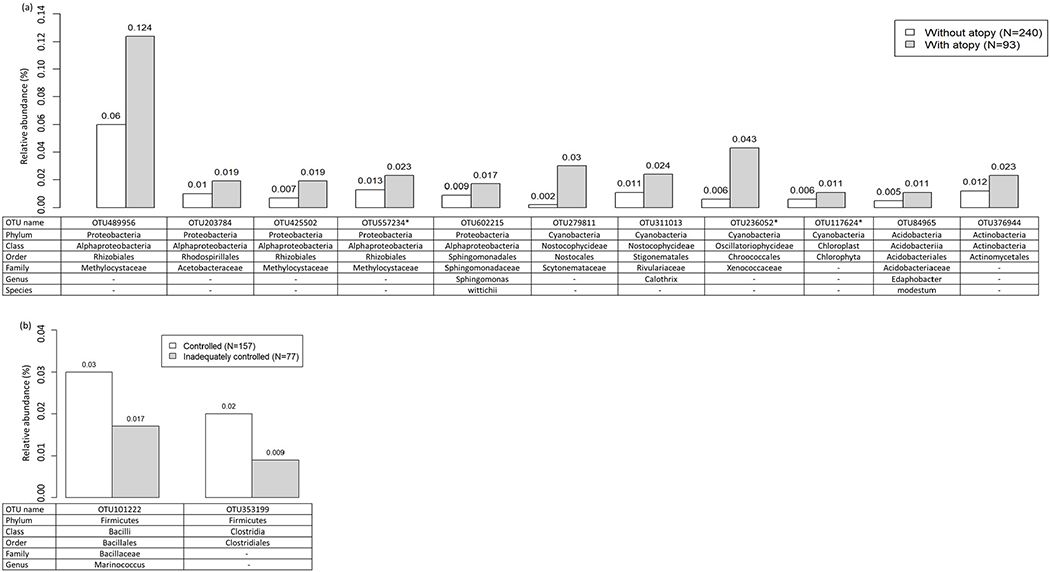
Average relative abundance of bacterial taxa associated with (a) atopy status and (b) degree of asthma control within asthmatics (FDR<0.05). Differentially abundant taxa by atopy status or degree of asthma control within asthmatics were identified by using ANCOM43. Rarefied (minimum number of sequences across samples=8,182) OTU data were used to calculate average relative abundance (%) of the taxa by atopic status (non-atopic asthmatics versus atopic asthmatics) or degree of asthma control status (asthmatics with adequately controlled asthma versus asthmatics with inadequately controlled asthma) within asthmatics. *OTUs also differentially abundant (FDR<0.05) by atopy status in analysis of all participants regardless of asthma status.