
FIGURE 3.
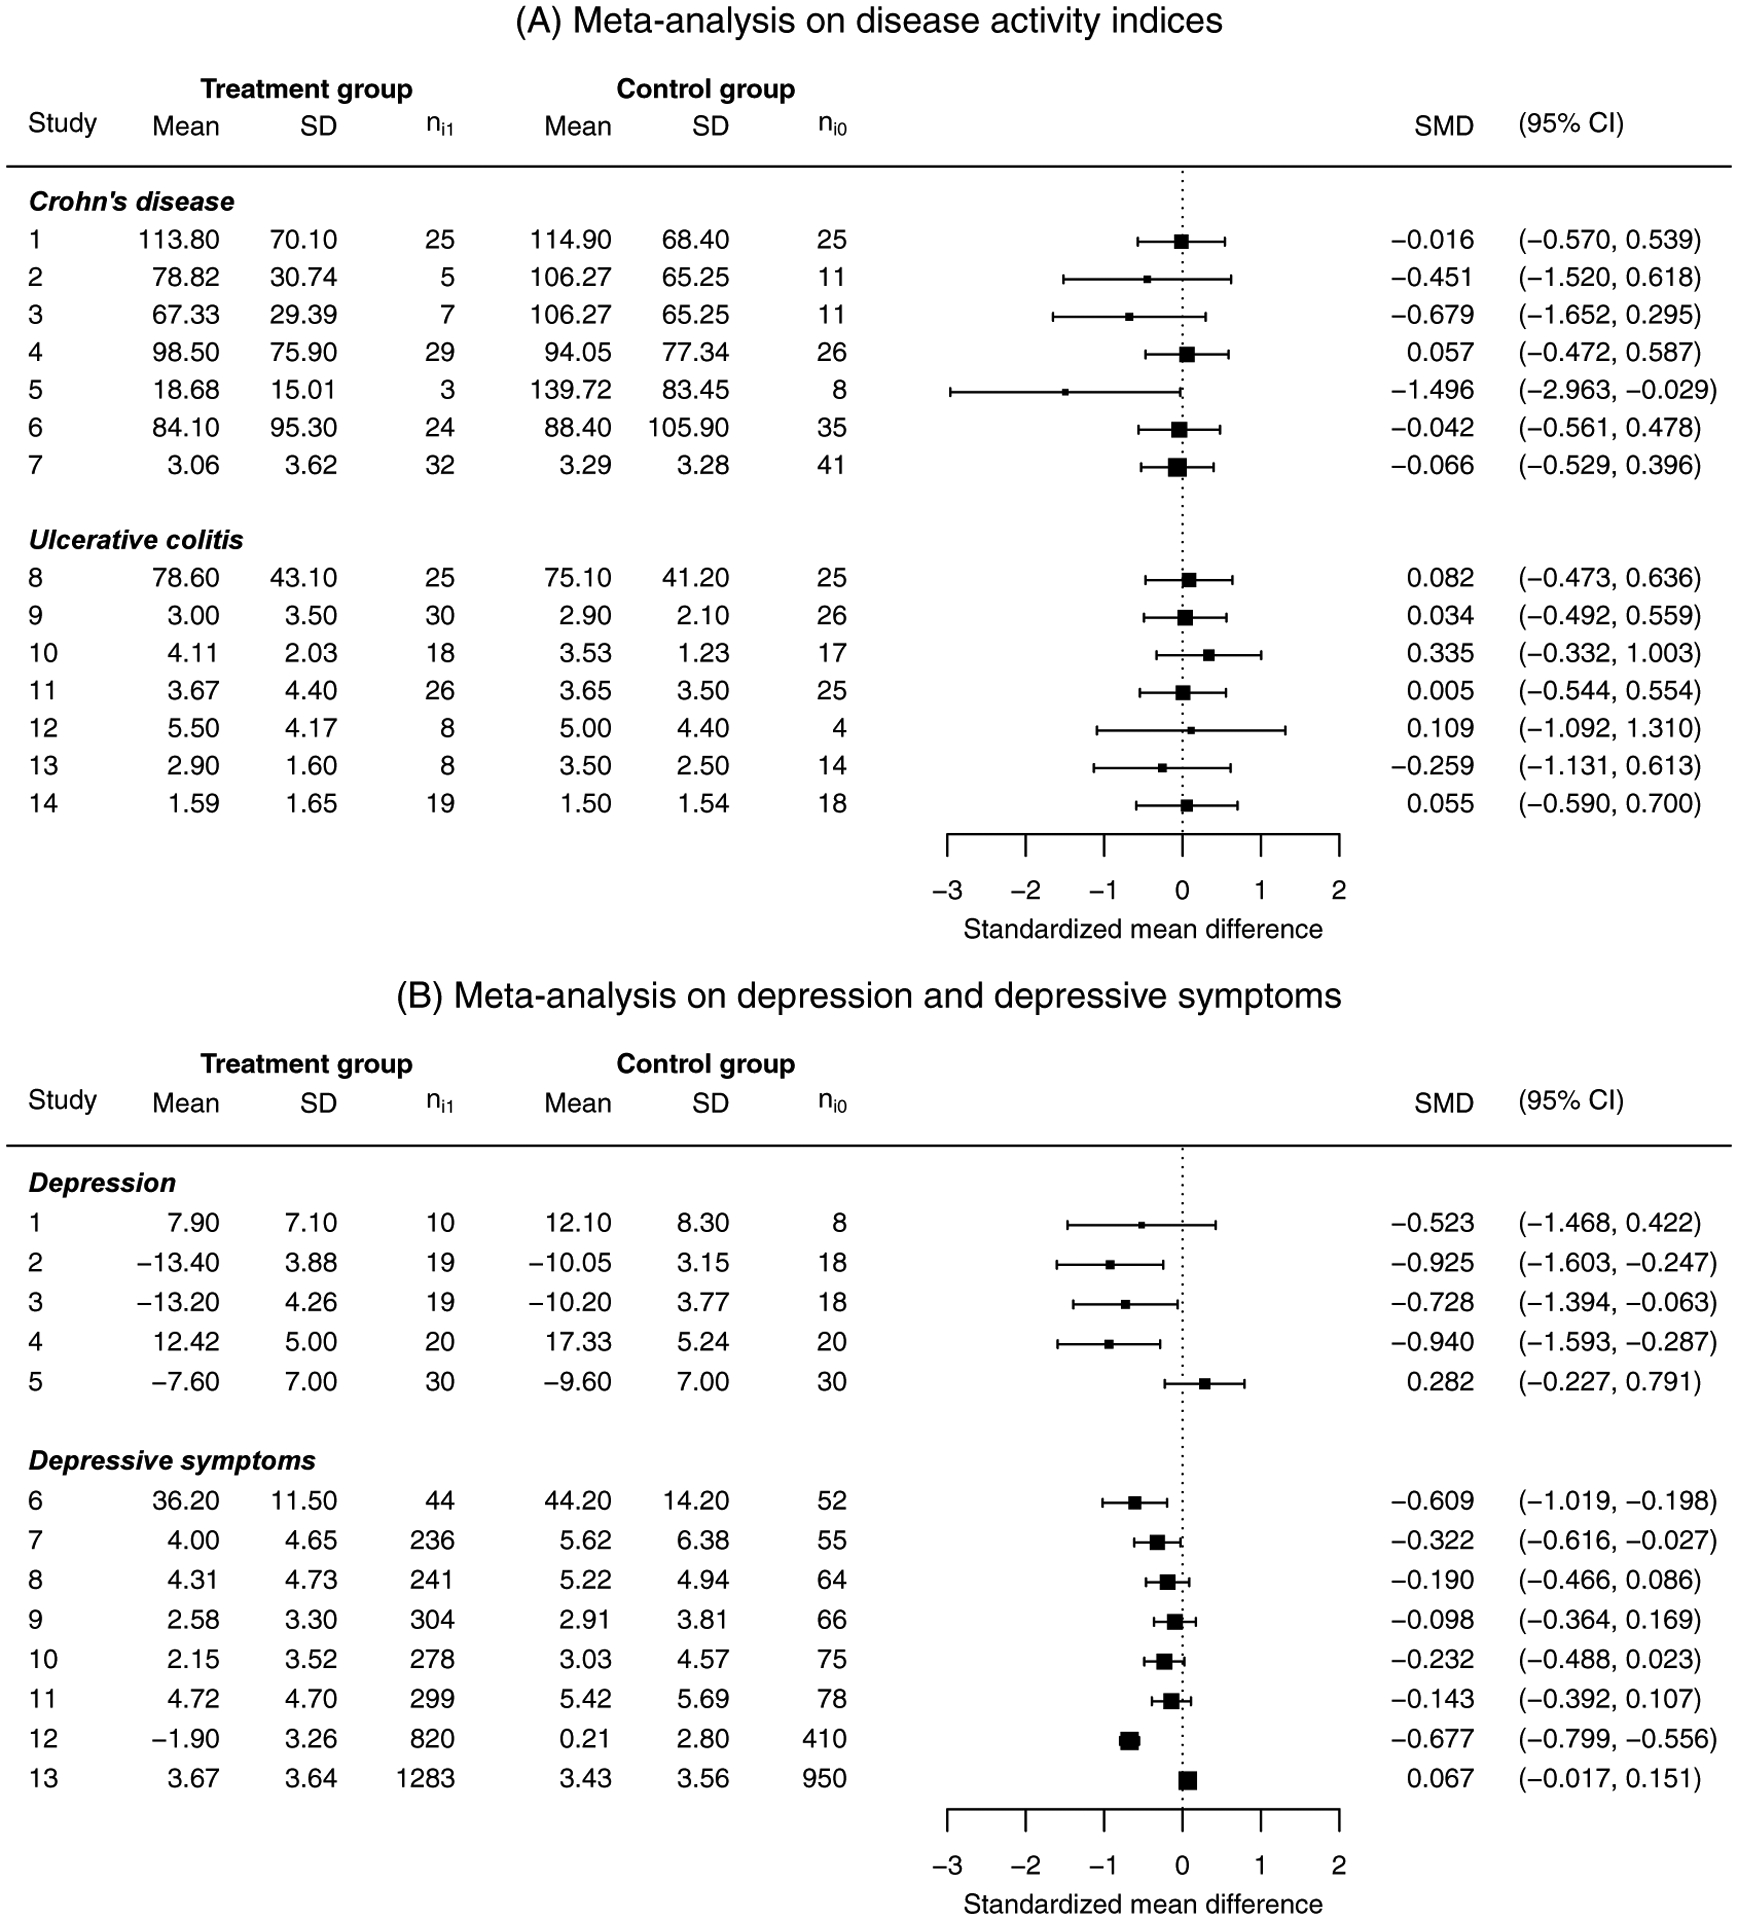
Forest plots of meta-analyses on disease activity indices (A) and on depression and depressive symptoms (B). The columns “Mean” and “SD” represent the continuous outcome measures’ sample means and sample standard deviations in the control or treatment group, respectively. The column “SMD” gives the standardized mean difference with its 95% confidence interval for individual studies, calculated using Hedges’ g with the variance estimator in Equation (13).