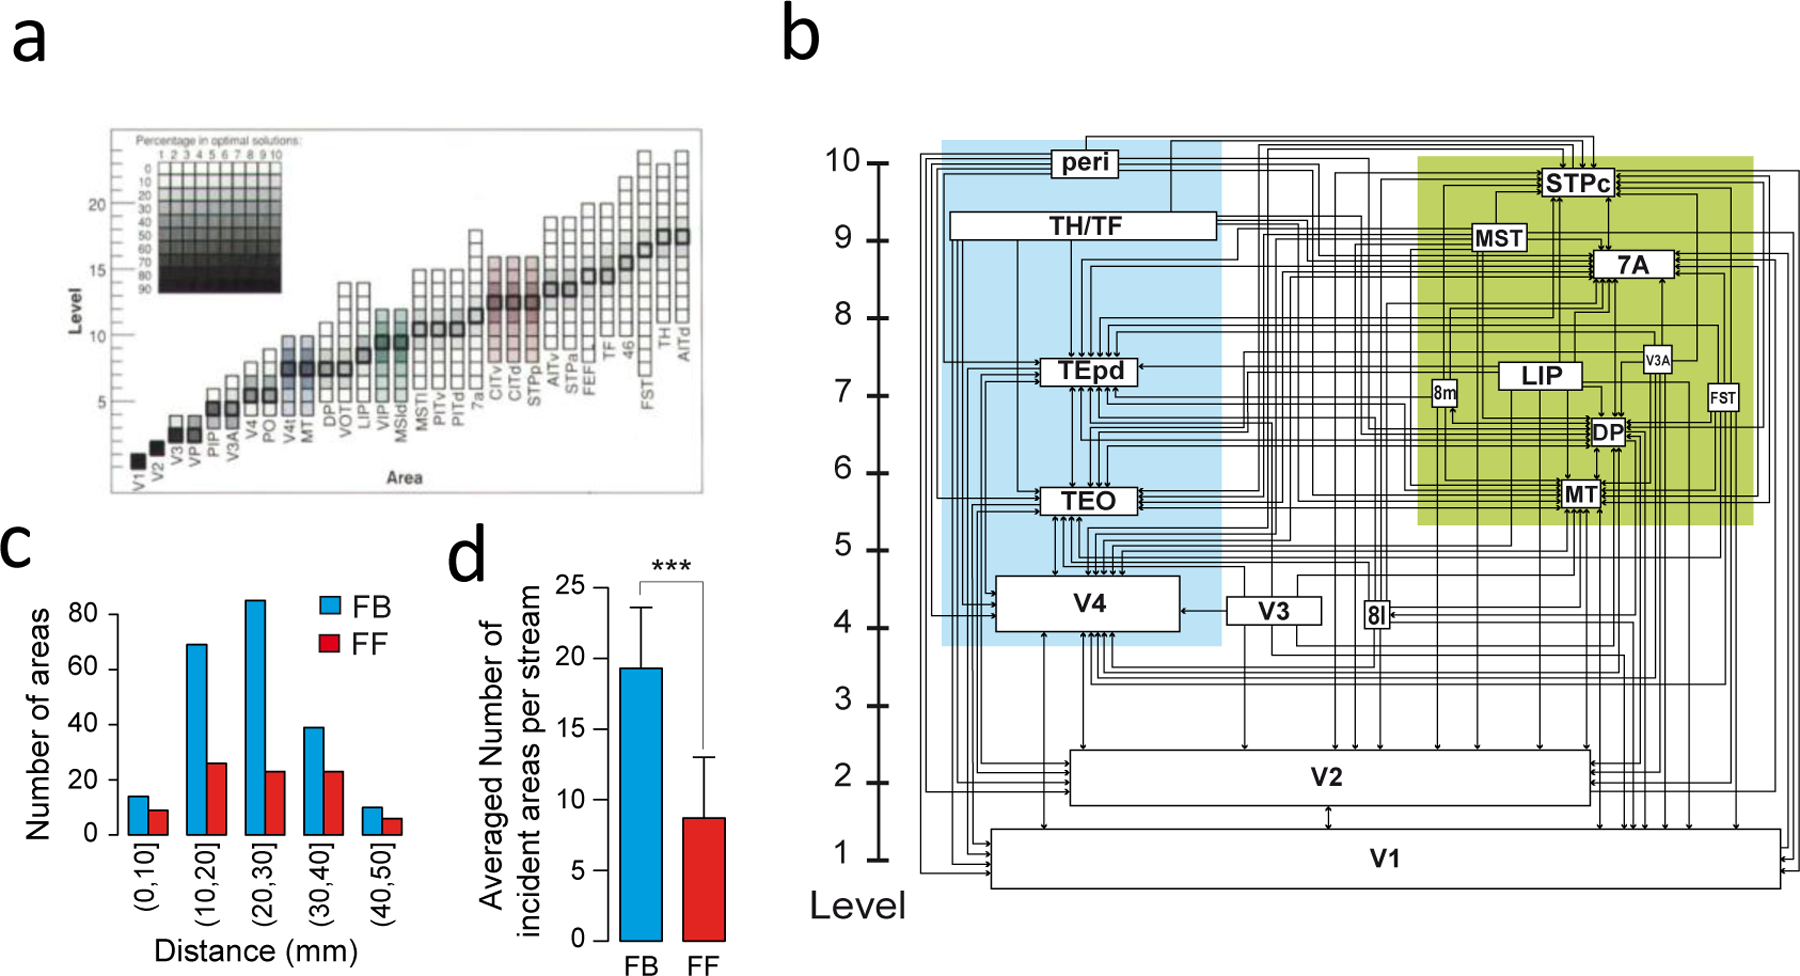
Figure 1. Quantitatively defined hierarchical model of the macaque visual cortex.

(a) Area frequency distributions of the 150,000 solutions to the Felleman and Van Essen (1991) model (77). (b) The indeterminacy shown in (a) is resolved by statistically modeling the SLN index. In this scheme the hierarchical distance between levels is determined by the laminar distributions of the set of areas (66). This captures many of the features of the Felleman and Van Essen model but there are significant differences namely the relatively low level of the small-saccade component of the FEF which is at a considerably lower lever. In this version of the hierarchy, the box sizes indicating individual areas are proportional to there dimensions in the brain. (c) Influence of distance from target area, shows that feedback (FB) connections have considerably longer reach than do feedforward (FF). (d) Proportions of the two pathways show that FB pathways are twice as numerous as FF pathways. (a) is reproduced from(77); (b), (c) and (d) are modified from (16).
