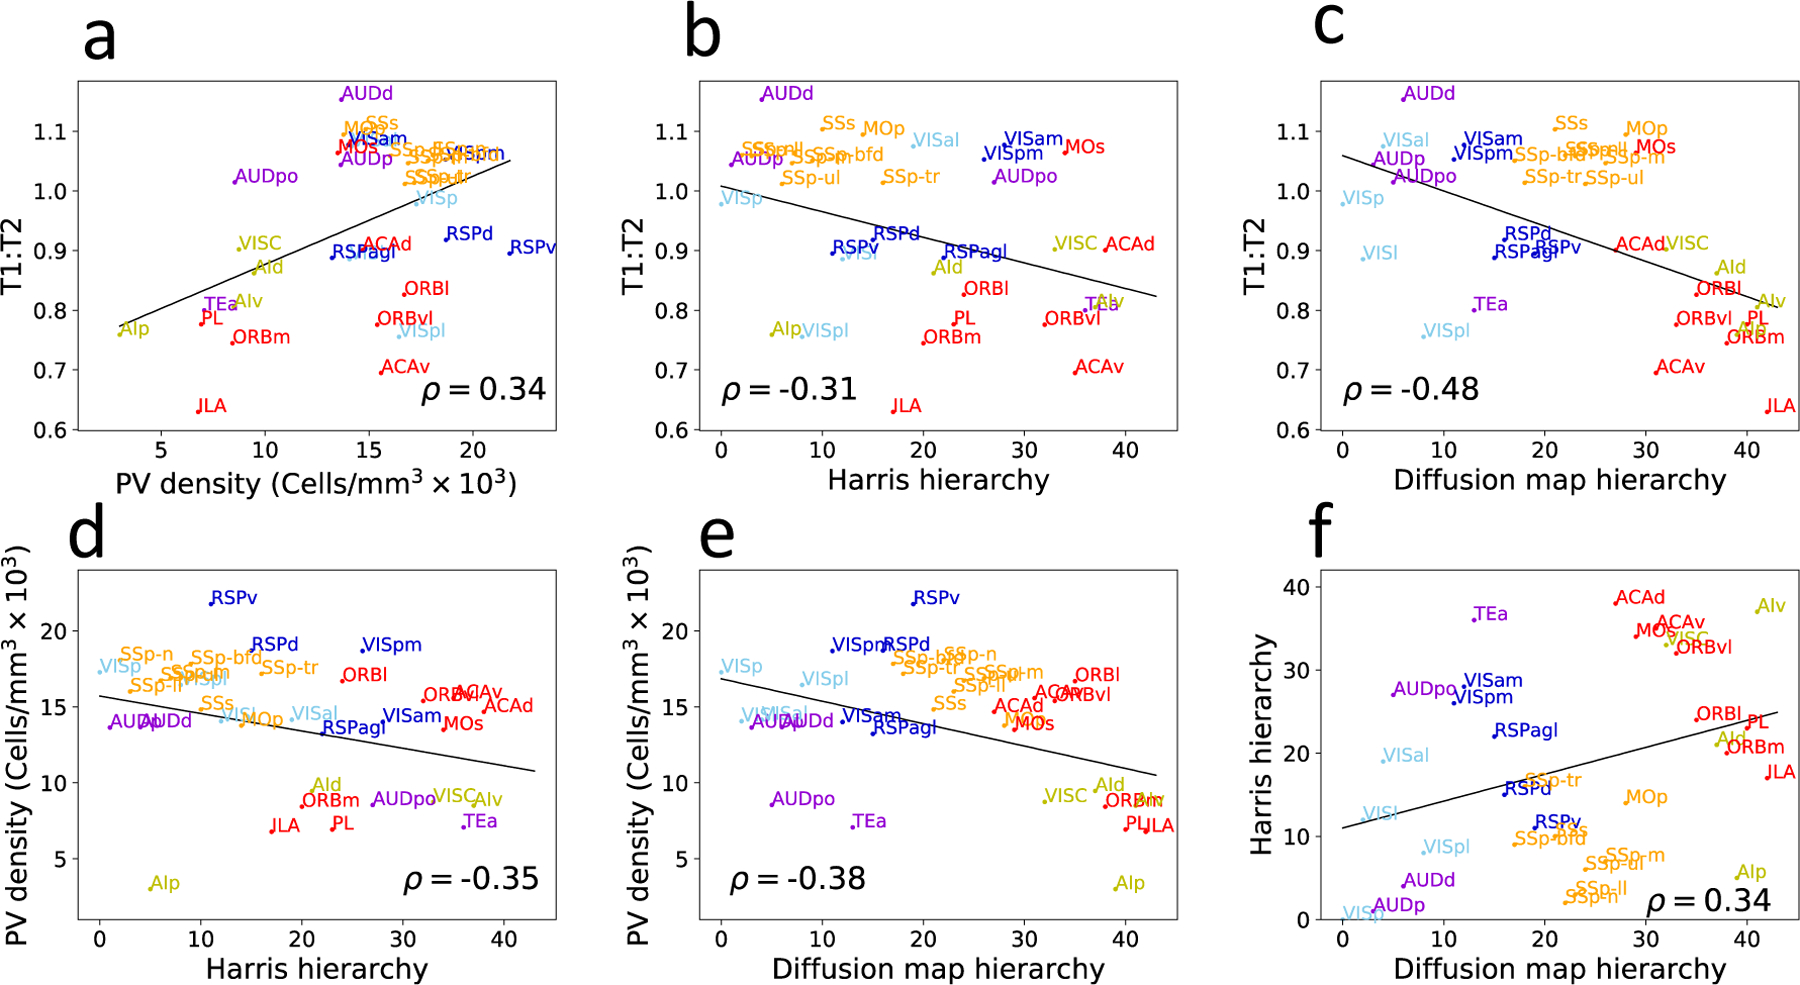
Figure 2: Cortical hierarchy in the mouse can be defined by four different measures:

T1w:T2w ratio (41) and PV neuron density (38) decrease, whereas the diffusion map measure and the Harris measure based on layer-dependent connectivity (21) generally increase with the hierarchy. The pairwise correlation between these four measures, however, typically have a correlation of about 0.3–0.5.
