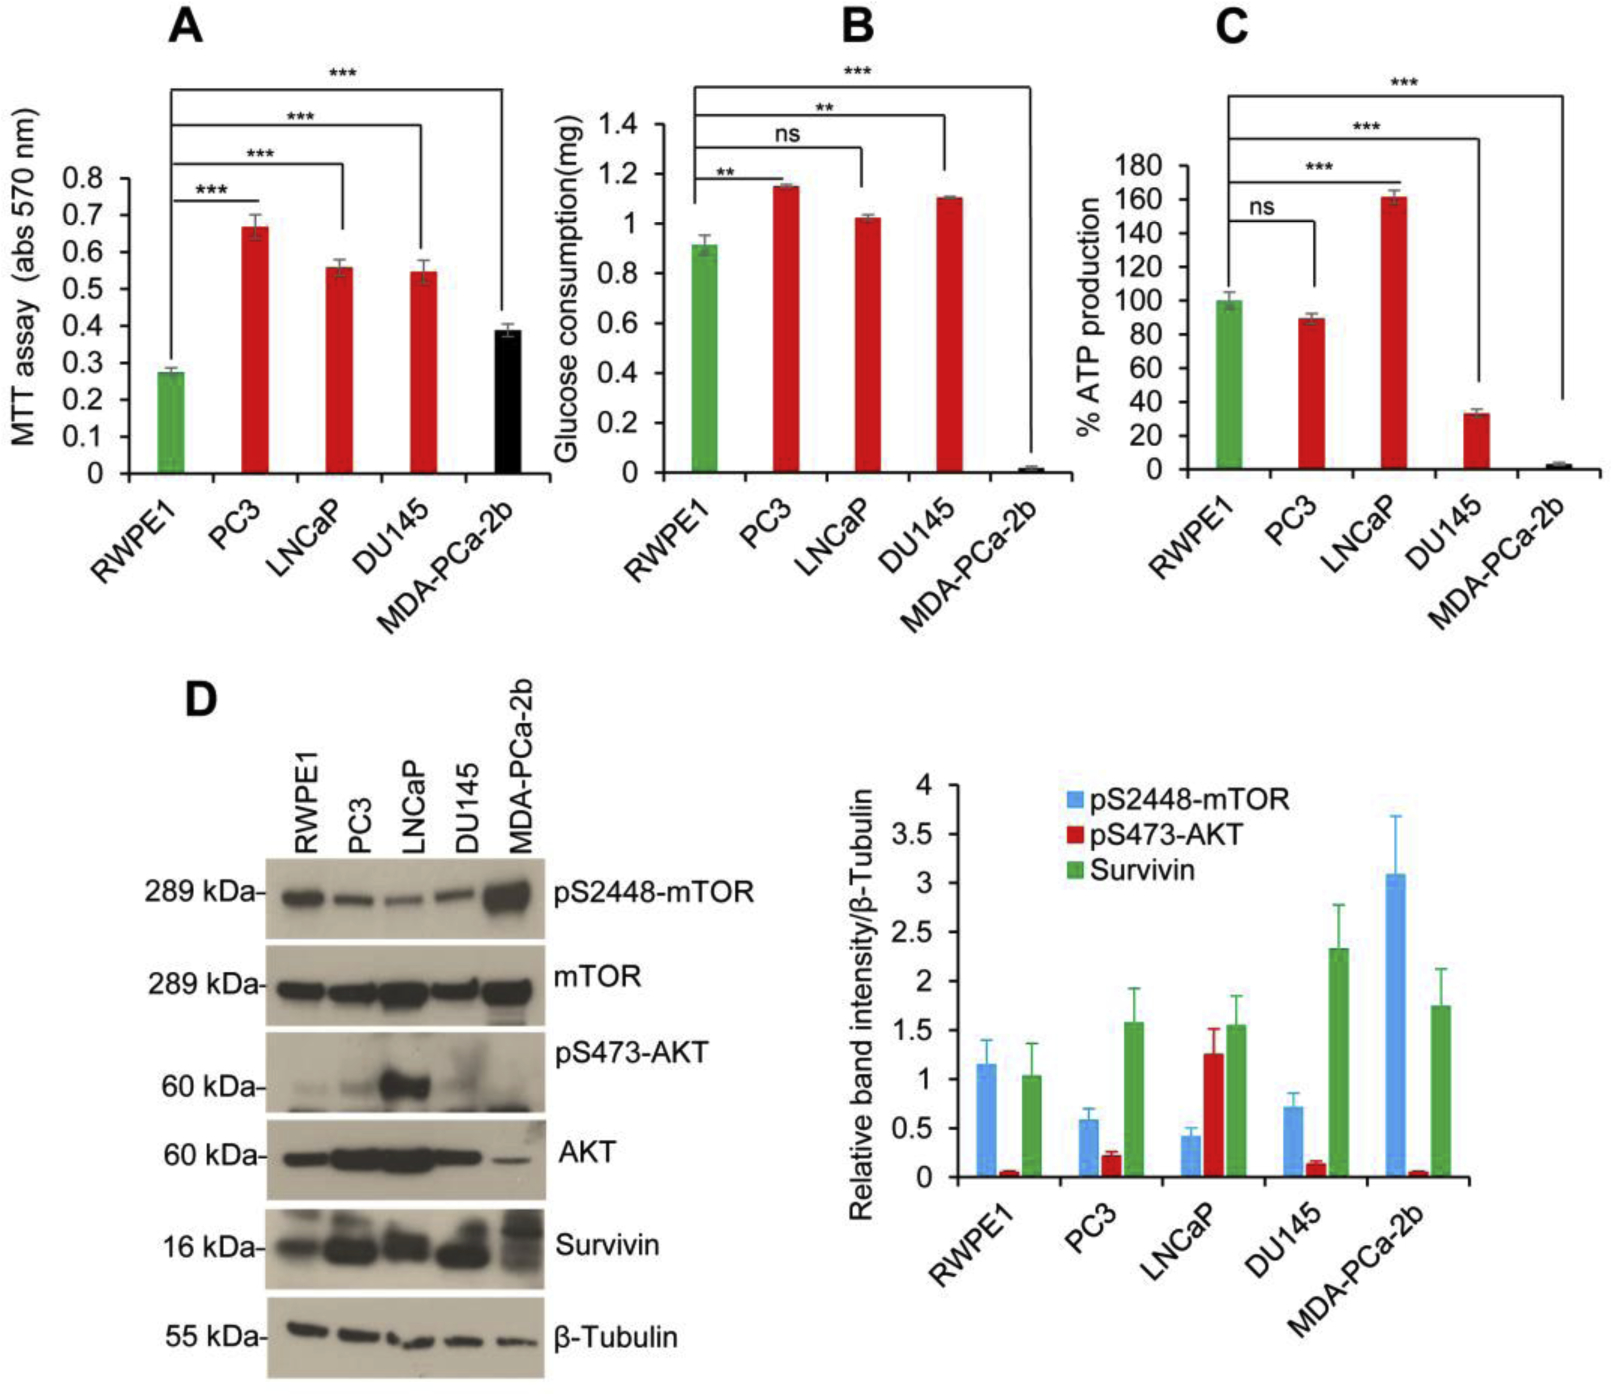
Fig. 1.

PCa cells show altered cell survival, glucose consumption, and ATP production. (A) RWPE1, PC3, LNCaP, DU145, and MDA-PCa-2b cells (1×10⁴) were grown in 96 well plates for 72h, and relative cell metabolic/cell survival activity was analyzed by MTT assay. (B) Normal prostate RWPE1 and PCa cells (1×10⁵) were grown in six-well plates in regular medium for 40h, and the relative glucose consumption was analyzed using a glucose determination kit GAHK-20 as described in the materials and methods section. (C) RWPE1 and PCa cells (1×10⁵) were grown in six-well plates in regular medium for 40h and cell extracts were prepared. The relative endogenous ATP production was measured by using a Luminometric ATP Assay Kit as described in the materials and methods section. (D) RWPE1, PC3, LNCaP, DU145, and MDA-PCa-2b cells (1×10⁵) were grown in six-well plates for 40h and cell lysates (50 μg) were immunoblotted with indicated antibodies (left panel). Indicated protein levels from (D) were quantified using ImageJ software (https://imagej.nih.gov/ij/) and plotted (right panel). Data represent mean ± SEM. **P<0.01 ***P<0.001, compared to normal prostate RWPE1 cells. ns - not significant.
